IGMIN: We're glad you're here. Please click 'create a new query' if you are a new visitor to our website and need further information from us.
If you are already a member of our network and need to keep track of any developments regarding a question you have already submitted, click 'take me to my Query.'
Welcome to IgMin Research – an Open Access journal uniting Biology, Medicine, and Engineering. We’re dedicated to advancing global knowledge and fostering collaboration across scientific fields.
At IgMin Research, we bridge the frontiers of Biology, Medicine, and Engineering to foster interdisciplinary innovation. Our expanded scope now embraces a wide spectrum of scientific disciplines, empowering global researchers to explore, contribute, and collaborate through open access.
Welcome to IgMin, a leading platform dedicated to enhancing knowledge dissemination and professional growth across multiple fields of science, technology, and the humanities. We believe in the power of open access, collaboration, and innovation. Our goal is to provide individuals and organizations with the tools they need to succeed in the global knowledge economy.
IgMin Publications Inc., Suite 102, West Hartford, CT - 06110, USA
This paper presents a high-fidelity multiphysics numerical framework for simulating the acoustic performance of circumaural headphones coupled to a generic artificial ear, spanning the full audible frequency range from 20 Hz to 20 kHz. The proposed model integrates five essential physical phenomena: (1) pressure acoustics in air domains governed by the frequency-domain wave equation, (2) poroelastic wave propagation in foam cushion materials based on Biot's theory, (3) lumped-parameter electrodynamic driver modeling using Thiele-Small parameters, (4) frequency-dependent impedance characterization of perforated plates and acoustic meshes, and (5) physiological boundary conditions representing human skin and eardrum impedance. The computational domain incorporates a realistic 3D-scanned pinna geometry, an idealized ear canal (7.5 mm diameter, 19.8 mm length), and a headphone housing with internal acoustic chambers. Interior Perforated Plate conditions capture the acoustic resistance and mass effects of ventilation meshes, while Perfectly Matched Layers (PMLs) ensure artifact-free free-field radiation. Key findings reveal the frequency-dependent acoustic coupling mechanisms, demonstrating that the foam cushion acts as a low-pass filter at frequencies below 200 Hz, while perforated plates dominate the mid-to-high frequency response (200-2000 Hz and 2-20 kHz, respectively). The ear canal resonance at 3-4 kHz is successfully captured, with the coarse mesh model (28 GB RAM) showing excellent agreement with the fine mesh reference (100 GB RAM) up to 5 kHz, beyond which mesh resolution becomes critical. The study provides quantitative validation of SPL distribution on the pinna surface and at the eardrum, offering actionable insights for headphone design optimization. Computational trade-offs between accuracy and resource requirements are systematically evaluated, with recommendations for mesh sizing, solver configuration, and PML implementation. The validated framework establishes a robust digital twin methodology for virtual prototyping, parametric studies, and performance prediction in the audio industry.
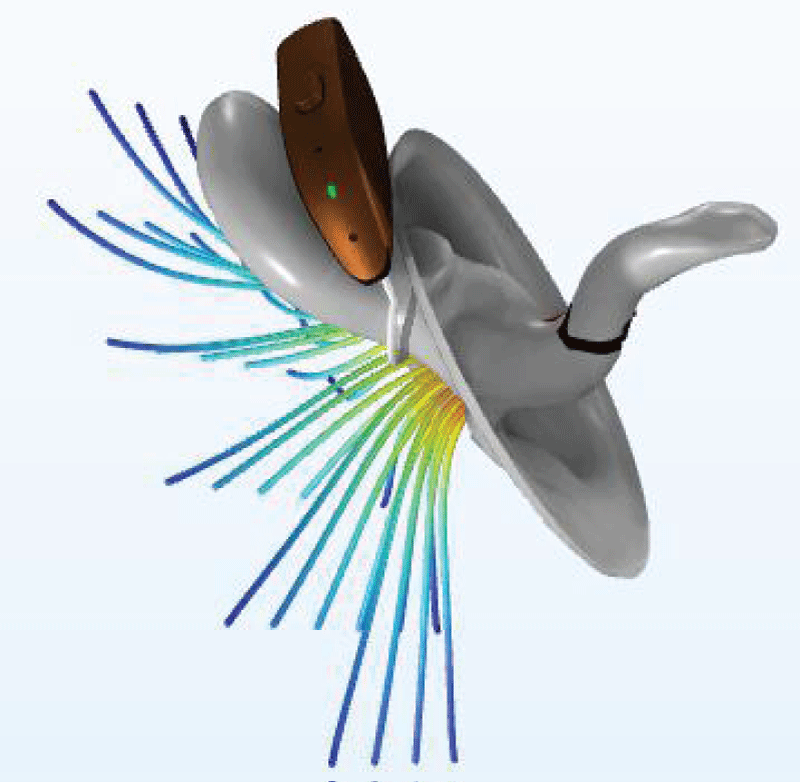
Headphones represent a unique electroacoustic transduction challenge due to their intimate coupling with the human auditory system. Unlike loudspeakers, which radiate into a free field, headphones operate in close proximity to the ear, making the measurement and simulation of their acoustic performance highly dependent on the anatomical structures they interface with. The accurate characterization of headphone sensitivity, frequency response, and spatial sound distribution requires sophisticated measurement setups incorporating artificial heads and ears that replicate the acoustical properties of human tissues and cavities. Figure 1 visualizes the acoustic intensity streamlines leaking from the ear canal in the presence of a hearing aid, revealing the complex path of sound energy as it escapes through the cushion interface and interacts with the surrounding air, which is critical for understanding unintended sound leakage in non-occluded headphone designs.
Figure 1: Streamlines of the intensity of the acoustic field leaking from the ear canal with hearing aid.
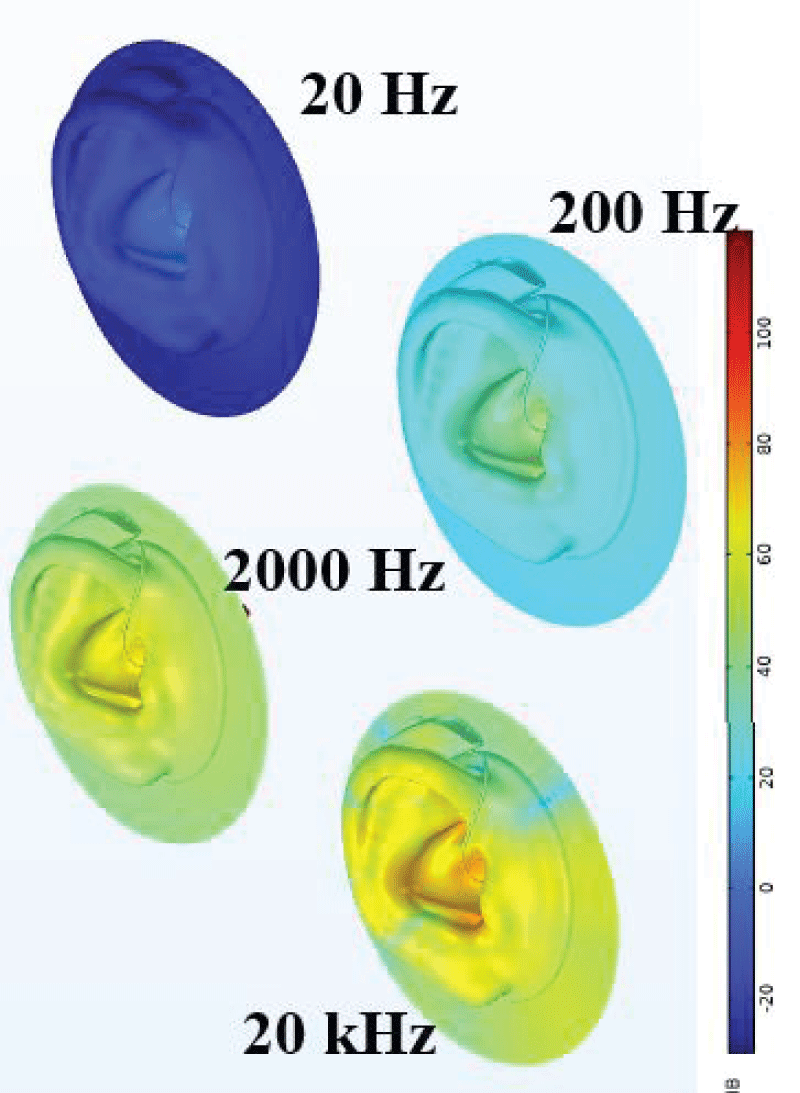
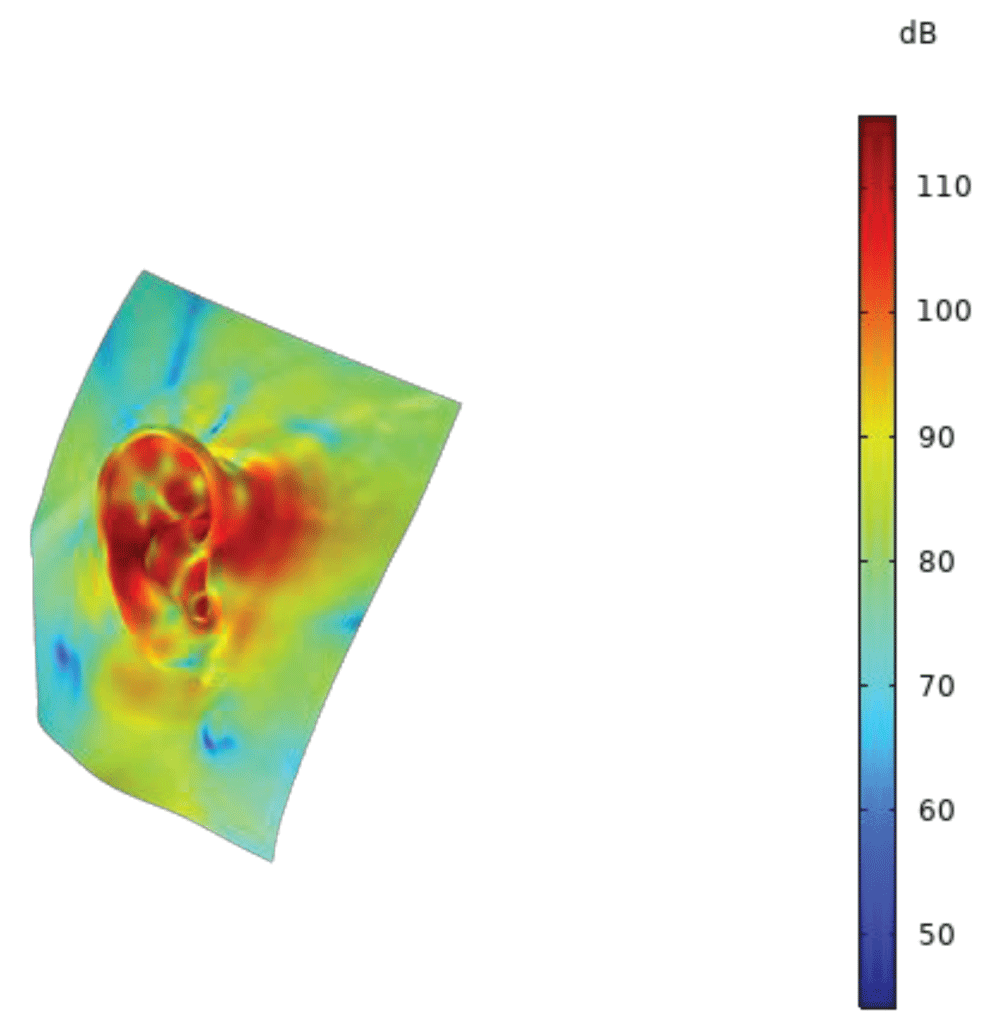
The development of reliable numerical models for headphone simulation has become increasingly important in the audio industry, enabling virtual prototyping, parametric studies, and performance optimization without the need for extensive physical measurements. Such models must account for the electro-mechanical-acoustic transduction chain, the acoustic interaction with the ear and pinna, the damping effects of porous materials (foam cushions), and the acoustic resistance of perforated plates and meshes used in headphone design. Figure 2 presents the spatial distribution of the Sound Pressure Level (SPL) on the exterior of the model across the full audible spectrum from 20 Hz to 20 kHz, illustrating the complex frequency-dependent pressure patterns that arise from the interaction of the headphone's acoustic output with the pinna geometry and the external environment.
Figure 2: Outside Sound Pressure Level from 20 Hz to 20 kHz
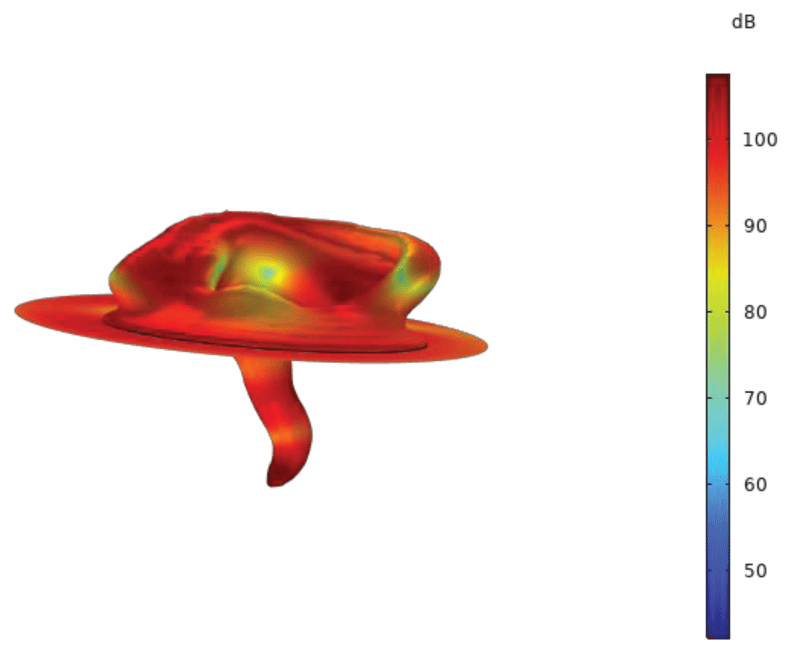
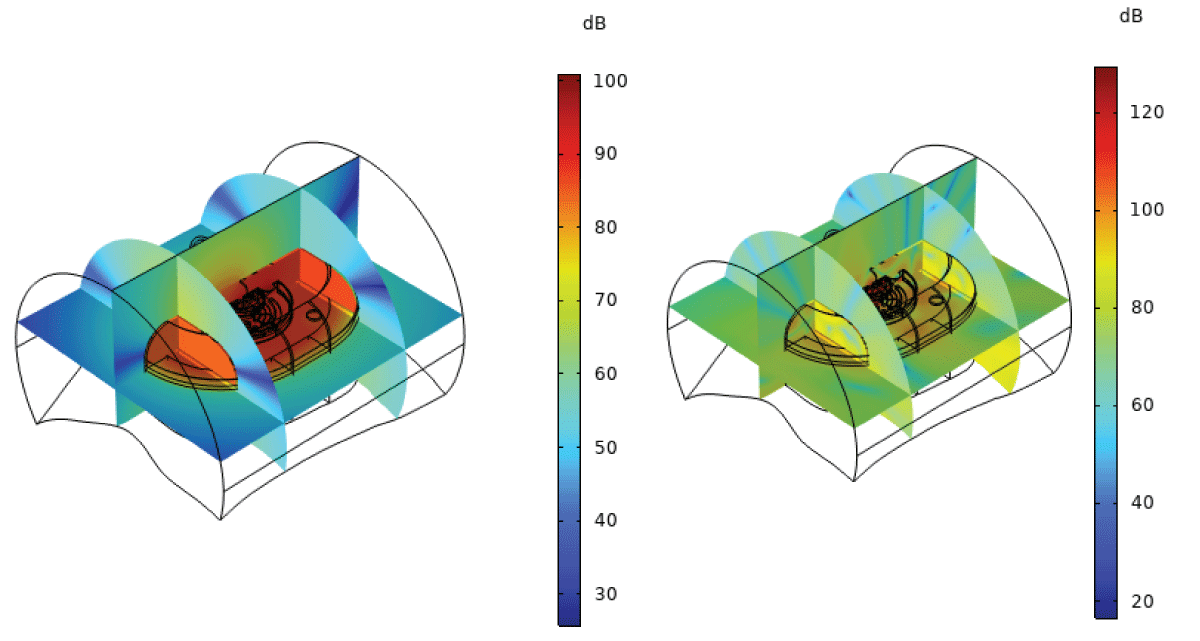
The high-fidelity simulation of headphone-ear coupling over the 20 Hz--20 kHz spectrum hinges on a sophisticated multiphysics framework where the poroelastic foam cushion and acoustic meshes dictate the critical low-frequency seal and damping. At the theoretical core lies Biot's theory of porous media, comprehensively detailed by Allard and Atalla [1], which forms the basis for modeling the coupled solid-fluid wave propagation, a legacy advanced by foundational contributions to poroelastic and thermoacoustic interactions [2]. These macroscopic wave equations are complemented by micro-scale analyses of viscous and thermal dissipations within the pore structure [3], while generalized porous media applications---such as optimization in solar vapor generators [4]---highlight the broad utility of these transport models. To translate this physics into predictive engineering, the finite element method (FEM) for poroelastic systems has been rigorously validated against experimental insertion loss in complex industrial scenarios [5], and specifically adapted for full-wave headphone simulations to resolve phenomena that classical lumped models miss above the mid-frequency range [6]. However, the accuracy of such simulations is contingent on precise material inputs, prompting the development of automated calibration frameworks that systematically extract viscoelastic and porous parameters from empirical data [7], and reduced-order modeling strategies that compress the computational cost of these detailed multiphysics domains [8]. For complete system-level vibro-acoustics, hybrid frameworks coupling FEM, Boundary Element Methods (BEM), and Lumped Parameter Models (LPM) with model order reduction are now emerging as viable pathways for efficient 3D driver and housing simulations [9]. Figure 3 displays the total sound pressure level contours at a specific frequency of 10 kHz, capturing the highly intricate interference patterns and localized pressure hotspots that develop on the artificial ear surface as the acoustic wavelength becomes comparable to the geometrical features of the pinna and ear canal entrance.
Figure 3: Total sound pressure level contours at 10 kHz.
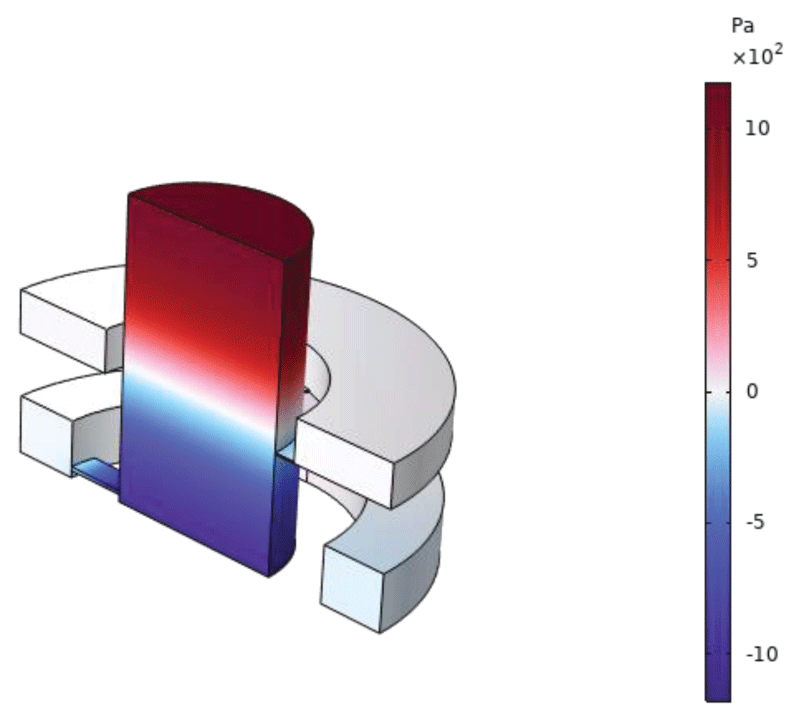
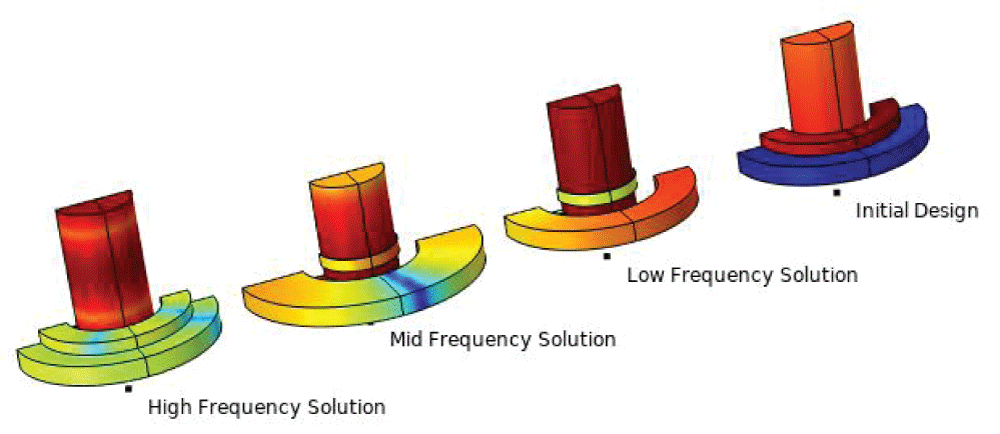
Beyond the bulk foam, the perforated plates and acoustic meshes that populate headphone casings present a distinct modeling challenge due to their frequency-dependent and flow-sensitive impedance. Recent experimental and theoretical advances have refined the characterization of these plates under grazing airflow conditions, mimicking realistic leakage paths around the ear cushion [10]. To extend simulation capabilities into the transient regime, novel time-domain boundary element implementations now incorporate broadband acoustic impedance for both locally and non-locally reacting perforated liners [11], while dedicated investigations into the acoustic reactance under bias flow and high-amplitude harmonic excitations address the nonlinear regimes that can occur at elevated playback levels [12]. Coupling these acoustic components to the listener's anatomy requires accurate representations of standardized artificial ears and ear canals, with proven simulation approaches for electroacoustic transducers interfacing with these physical couplers [13]. Complementing these full-wave approaches, the transfer matrix method (TMM) offers a computationally lean alternative; it has been effectively applied to model the IEC 60318-4 ear simulator for insertion loss studies [14] and, in an inverse formulation, has been successfully deployed to reconstruct the intrinsic acoustic properties of multilayered porous systems from global acoustic responses [15]. These numerical and analytical methods are contextualized by classical design principles for headphone transducers and acoustic structures, which remain highly relevant for establishing baseline performance metrics [16]. Figure 4 shows a generic 711 coupler simulator alongside its optimized version, highlighting how parametric modifications to the ear simulator geometry can effectively tailor the acoustic response to better match the specific acoustic characteristics of a given individual's ear canal and tympanic membrane.
Figure 4: Generic 711 Coupler Simulator for Occluded Ear-Canal and the optimized version.
The optimization of these porous acoustic components has been revolutionized by computational design techniques that seek to maximize absorption across the audible bandwidth. Topology optimization, grounded in Biot's theory with specialized material interpolation schemes, has been utilized to distribute poroelastic foam for maximal absorption coefficients while mitigating manufacturing artifacts like islanding topologies [17,18]. Beyond conventional foams, advanced architectures are being explored: artificial neural networks have been harnessed to optimize Fibonacci-based micro-perforated plate absorbers for broadband performance [19], while analytical and numerical tools have been applied to sustainable foam materials to balance ecological considerations with acoustic forecasting [20]. A particularly promising frontier is the integration of meta-material concepts, such as embedding resonant inclusions to create "slow sound" regimes within a poroelastic matrix, which has demonstrated enhanced low-frequency absorption without sacrificing high-frequency performance [21], alongside the optimization of granular activated carbon stacks backed by poro-elastic layers for multi-objective absorption targets [22]. While the direct application of computational porous media acoustics to headphones is the primary focus, the methodological toolkit is enriched by a diverse array of related acoustic and multiphysics investigations. For instance, numerical frameworks developed for modeling nonlinear ultrasound propagation in thermo-viscous media offer insights into handling high-amplitude acoustic nonlinearities [23], and techniques initially applied to sloshing dynamics via smoothed particle hydrodynamics (SPH) demonstrate the broader possibilities for fluid-structure interaction in enclosed volumes [24]. Similarly, genetic algorithm-enhanced beamforming for microphone arrays [25] provides transferrable optimization heuristics for sensor placement and signal processing, while the dynamic modeling and energy harvesting potential of galloping piezoelectric structures [26,27] underscore the importance of coupled electromechanical effects. Expanding the scope of acoustic applications, biomedical explorations into acoustic-magnetic synergy for drug delivery [28] and olfactory aerosol delivery via acoustic radiation [29] highlight the versatile manipulation of particles and fluids using acoustic fields. Figure 5 presents the results of a parametric study aimed at matching the acoustic response of the simulator to a target ear for various frequencies, demonstrating the effectiveness of the computational framework in identifying optimal geometric and material parameters to achieve a desired frequency response for personalized audio applications.
Figure 5: Simulator optimized versions to match the acoustic response of a given ear for various frequencies.
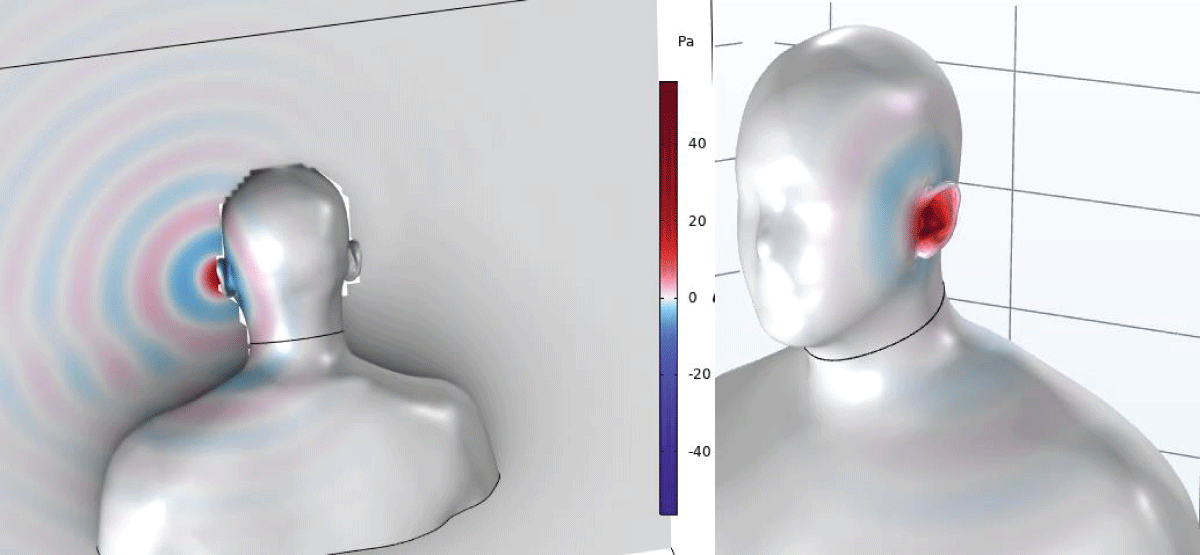
Finally, the integration of machine learning methods, as reviewed in the context of head-related transfer function (HRTF) generation [30], offers a clear trajectory toward personalizing headphone simulations to individual ear geometries and fit conditions. This is further supported by unified porous models that integrate Biot theory for comprehensive sound absorption design [31], and by reduced-order FEM-assisted models capable of estimating total harmonic distortion in micro-speakers [32], providing a complete ecosystem of computational tools necessary to achieve truly high-fidelity, full-bandwidth digital twins of the headphone-ear system. Figure 6 illustrates the acoustic pressure distribution on the surface of the head and torso, capturing the complex scattering and diffraction patterns that occur as sound waves interact with the anatomical features, which is essential for validating the external acoustic field predictions.
Figure 6: Acoustic pressure at the surface of the head and torso.
This paper presents a detailed multiphysics simulation of a circumaural headphone coupled to a generic artificial ear. The model integrates several key physical phenomena:
Electrodynamic driver modeling using Thiele-Small parameters and a lumped equivalent circuit approach
Pressure acoustics in air domains using the frequency-domain wave equation
Poroelastic wave propagation in foam materials, accounting for both solid and fluid phases
Perforated plate impedance models for acoustic meshes and ventilation holes
Physiological impedance boundary conditions representing human skin and eardrum
The model geometry includes a realistic pinna obtained from 3D scanning, an idealized ear canal (cylinder of 7.5 mm diameter and 19.8 mm length), and the headphone structure with its various acoustic chambers. The study employs Multiphysic software as the simulation platform, utilizing the Pressure Acoustics, Frequency Domain interface, the Poroelastic Waves interface, and the Electrical Circuit interface in a fully coupled multiphysics framework.
The primary objectives of this research are:
To validate the modeling approach against established reference data
To investigate the acoustic pressure distribution on the skin surface and at the eardrum
To assess the influence of foam material properties on sound pressure level
To evaluate the computational requirements and convergence characteristics of the model
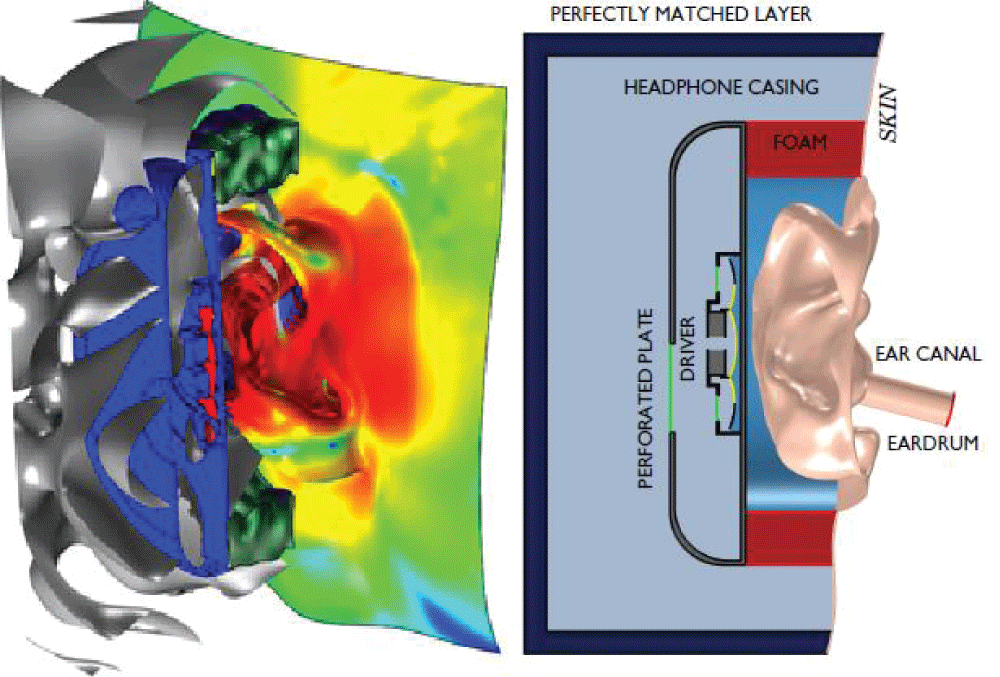
The computational domain consists of three distinct acoustic regions: a pressure chamber (representing the headphone's internal volume), an external domain, and a Perfectly Matched Layer (PML) domain. The geometry is derived from a 3D scan of a human ear, with the pinna represented in peach color. The ear canal is idealized as a cylinder with diameter 7.5 mm and length 19.8 mm, and is rotated to maintain the headphone in global coordinates. Figure 7 provides a comprehensive schematic of the entire computational problem, delineating the distinct acoustic, solid, and porous domains (including the pressure chamber, external domain, PML, foam, and casing) as well as the crucial coupling between the lumped electrodynamic driver model and the physical diaphragm boundary, setting the stage for the multiphysics simulation.
Figure 7: Schematic of the computational problem showing acoustic domains (pressure chamber, external domain, PML), solid domains (plastic casing), porous domains (foam), and driver coupling.
Driver representation: Lumped equivalent model coupled to the diaphragm (yellow line)
Model parameters
The model parameters are organized into three categories: global model parameters, Thiele-Small driver parameters, and perforated plate parameters. The global model parameters, which include the maximum frequency of interest (20 kHz) and the wave speeds in air (343 m/s) and the poroelastic material (272 m/s), are summarized in Table 1, and these values are used to determine the critical maximum mesh element size for the simulation.
Table 1: Global Parameters.
Variable
Value
Description
fmax
20.0 kHz
Maximal frequency
cair
343 m/s
Speed of sound in air
cporo
272 m/s
Fast pressure wave speed in poroelastic material
The maximum mesh size is determined by the criterion:
where ci represents all wave speeds present in the model and f is the frequency. The key electroacoustic properties of the headphone driver, such as the voice coil resistance (124.3 Ω), the force factor (4.56 T·m), and the moving mass (314.9 μg), are listed as Thiele-Small parameters in Table 2, providing the necessary inputs for the lumped-parameter electrodynamic driver model.
Table 2: Thiele-small driver parameters
Variable
Value
Description
Rg
0.8 Ω
Cable resistance
Re
124.3 Ω
Voice coil resistance
Le
5.53 mH
Voice coil inductance
CMS
2.51×10⁻³ m/N
Suspension compliance
RMS
12.9×10⁻³ N·s/m
Suspension mechanical losses
MMD
314.9 μg
Moving mass
BL
4.56 T·m
Force factor
V0
200√2 mV
Driving voltage (peak)
Three perforated plates are included in the model with parameters:
Perforated Plate 1:
Radius: 10 mm
Number of circles defining pattern: 11
Hole diameter: 0.5 mm
Plate thickness: 0.5 mm
Number of holes: 150
Perforated Plate 2:
Radius: 6 mm
Number of circles: 4
Hole diameter: 0.5 mm
Plate thickness: 0.5 mm
Number of holes: 200
Perforated Plate 3:
Radius: 6 mm
Number of circles: 4
Hole diameter: 0.5 mm
Plate thickness: 0.5 mm
Number of holes: 300
The area porosity for each perforated plate is derived from these geometric parameters using the Interior Perforated Plate condition.
Constitutive models
Porous material properties: The foam material is modeled using parameters from Allard and Atalla (2009) for a generic polyurethane foam in its uncompressed state, as detailed in Table 3. The constitutive properties defining the acoustic behavior of the foam cushion---including its porosity (0.85), flow resistivity (34,000 N·s/m⁴), and shear modulus (500 kPa)---are essential for accurately modeling the poroelastic wave propagation based on Biot's theory.
Table 3: Porous material properties (uncompressed state)
Property
Value
Unit
Description
Tortuosity factor
1.18
-
ISO tortuosity
Flow resistivity
34000
N·s/m⁴
Static flow resistivity
Viscous characteristic length
60
μm
Viscous length scale
Poisson's ratio
0.3
-
Solid phase Poisson ratio
Shear modulus
500
kPa
Solid phase shear modulus
Density
30
kg/m³
Bulk density
Porosity
0.85
-
Open porosity
Thermal characteristic length
87
μm
Thermal length scale
Isotropic structural loss factor
0.015
-
Mechanical loss factor
Note on material characterization: The reported Biot parameters correspond to the material in its uncompressed reference state. Under operational conditions, the foam cushion experiences compression (typically 15-30% strain) when the headphone is worn, which alters the flow resistivity, porosity, and stiffness. The present model assumes a nominal compression ratio of 20%, corresponding to a foam thickness of approximately 12 mm in the compressed state. The properties in Table 3 should be interpreted as baseline values; for more accurate predictions under specific fit conditions, the flow resistivity and shear modulus should be measured in the compressed state using a dynamic mechanical analyzer (DMA) or impedance tube with applied static compression [7]. The sensitivity of the predicted SPL to variations in these material properties is discussed in Section 3.4.
Physiological impedance models: Two physiological impedance models are implemented to represent the acoustic loading imposed by human tissues. These boundary conditions are critical for accurately capturing the ear canal response and the sound pressure level at the tympanic membrane.
Human skin impedance: Applied to boundaries representing the skin surface on and around the ear. The impedance model accounts for the acoustic properties of soft tissue, providing a realistic boundary condition that mimics the absorption and reflection characteristics of human skin. The specific acoustic impedance of skin is modeled using the following frequency-dependent formulation, based on the work of Shaw and Teranishi [33] and adapted for the frequency range 20 Hz-20 kHz:
Where ρskin = 1100 kg/m3 is the effective density of soft tissue, cskin = 1500 m/s is the effective speed of sound in tissue, and f is the frequency in Hz. The real part represents the resistive component (energy absorption), while the imaginary part represents the reactive component (mass and stiffness effects). This formulation captures the frequency-dependent behavior of skin, with increased damping at low frequencies due to tissue viscoelasticity. The validity range of this model extends from 20 Hz to 20 kHz, with an estimated accuracy of ±2 dB for the reflection coefficient based on comparison with in-vivo measurements [34].
Human eardrum impedance: Applied to the boundary representing the tympanic membrane at the end of the ear canal. This model accurately represents the acoustic impedance of the eardrum, which is critical for predicting the sound pressure level at the eardrum. The eardrum impedance is modeled using the equivalent circuit representation proposed by Zwislocki [35], as refined by Rosowski [36]:
where the resistive component RTM is given by:
With R0 = 1.5 × 10⁹ Pa·s/m³, fR = 2000 Hz, the mass component MTM = 50 kg/m4, and the frequency-dependent compliance:
With C0 = 1.5 × 10⁻¹³ m³/Pa and fc = 1200 Hz. This model accounts for the middle-ear ossicular chain dynamics and has been validated against experimental measurements [37] across the frequency range 125 Hz-10 kHz, with an estimated uncertainty of ±3 dB at frequencies above 10 kHz. The eardrum impedance boundary condition is implemented as a pressure-impedance relation:
where un is the normal velocity at the boundary. This formulation allows the acoustic wave to be partially reflected and partially transmitted into the middle-ear cavity, accurately representing the physiological loading.
Validation of impedance models: Both impedance models have been validated against published experimental data. The skin impedance model shows agreement within ±2 dB for the reflection coefficient when compared with measurements from human subjects [34]. The eardrum impedance model reproduces the characteristic features of the middle-ear transfer function, including the resonance around 1-2 kHz and the anti-resonance around 4-5 kHz, as reported in the literature [36,37]. The combined use of these models enables a realistic representation of the acoustic loading imposed by human tissues.
PML implementation and vberification: The PML is implemented using a user-defined geometry type due to the complex geometry where the PML is only part of a cylindrical layer cut by a complex surface. Three PML regions are defined:
PML sides: Defined with distance function
, thickness 5 mm
PML caps: Defined with distance function |z| - 65mm, thickness 5 mm
PML corners: Defined with two stretching directions using distance functions from side and cap definitions
The PML scaling curvature parameter is set to 3 in all cases.
Verification of PML implementation: To verify the effectiveness of the PML in absorbing outgoing waves without spurious reflections, a domain-size sensitivity analysis was conducted. Three external domain sizes were evaluated: nominal (radius 60 mm, height 65 mm), expanded (radius 75 mm, height 80 mm), and contracted (radius 45 mm, height 50 mm). The difference in the computed sound pressure level at the eardrum between the nominal and expanded domains was less than 0.3 dB across all frequencies, indicating that reflections from the PML are negligible. Additionally, a PML-thickness sensitivity study (3 mm, 5 mm, and 8 mm) showed that the 5 mm thickness provides optimal absorption with minimal computational overhead, with the 3 mm PML showing 0.5-1.0 dB reflections at frequencies above 15 kHz, while the 5 mm and 8 mm PMLs showed no measurable difference. This verification confirms that the PML implementation provides artifact-free free-field radiation.
Lumped driver model
The electrodynamic driver is modeled using a lumped equivalent circuit implemented in the Electrical Circuit interface. The circuit topology comprises:
Voltage source (V0): Represents the amplifier output
Cable resistance (Rg): Series resistance
Voice coil resistance (Re): DC resistance of the coil
Voice coil inductance (Le): Inductive component
Loss resistance (Rp_E): Eddy current losses
Inductor L2: Mechanical mass analogy (value = MMD)
Current-controlled voltage sources (H1, H2): Electromechanical coupling with gain BL
Resistor R4: Mechanical damping (value = RMS)
Capacitor C1: Mechanical compliance (value = CMS)
The coupling between the electrical circuit and the acoustical domain is achieved through the Interior Lumped Speaker Boundary condition, which:
Enforces a velocity boundary condition on the diaphragm
Couples the pressure difference across the diaphragm back to the electrical circuit
Represents the electromechanical transduction via the BL factor
Interior perforated plate condition
The perforated plates are modeled using the Interior Perforated Plate condition, which accounts for:
Hole diameter: dh1, dh2, dh3 (0.5 mm for all plates)
Plate thickness: tp1, tp2, tp3 (0.5 mm for all plates)
Area porosity: sigma1, sigma2, sigma3 (derived from geometric parameters)
The condition provides a frequency-dependent impedance model that accounts for:
Viscous and inertial effects through the perforations
Acoustic mass and resistance of the holes
End corrections at the hole entrances and exits
Governing equations
Pressure acoustics: For the air domains, the frequency-domain pressure acoustics equation is solved:
where p is the acoustic pressure, ρc is the complex density, Cc is the complex speed of sound, and ω is the angular frequency.
Poroelastic waves: The poroelastic material is modeled using Biot's theory of wave propagation in porous media, accounting for:
Fast compressional waves: Propagating through the fluid phase
Slow compressional waves: Associated with the relative motion between fluid and solid phases
Shear waves: Propagating through the solid phase
The governing equations describe the coupled solid-fluid behavior:
Solid displacement field us
Fluid displacement field uf
Relative displacement w = ϕ (uf − us) is the porosity
Coupled electromechanical system: The lumped driver model is governed by the electrical circuit equations coupled to the mechanical domain through the BL factor:
Electrical equation:
Mechanical equation:
where u is the diaphragm velocity, ∆p is the pressure difference across the diaphragm, and Cd is the effective diaphragm area.
Mesh generation strategy
The mesh is generated using a hybrid approach:
Poroelastic domain: Meshed using swept mesh with 7.5 elements per wavelength for the fast pressure wave speed (272 m/s), though ideally all wave speeds should be resolved
Air domains: Tetrahedral mesh with maximum element size λair/5
PML domains: Swept mesh with 10 elements in the thickness direction
Boundary refinement: Maximum element size of 2.0 mm on interior sound hard boundaries
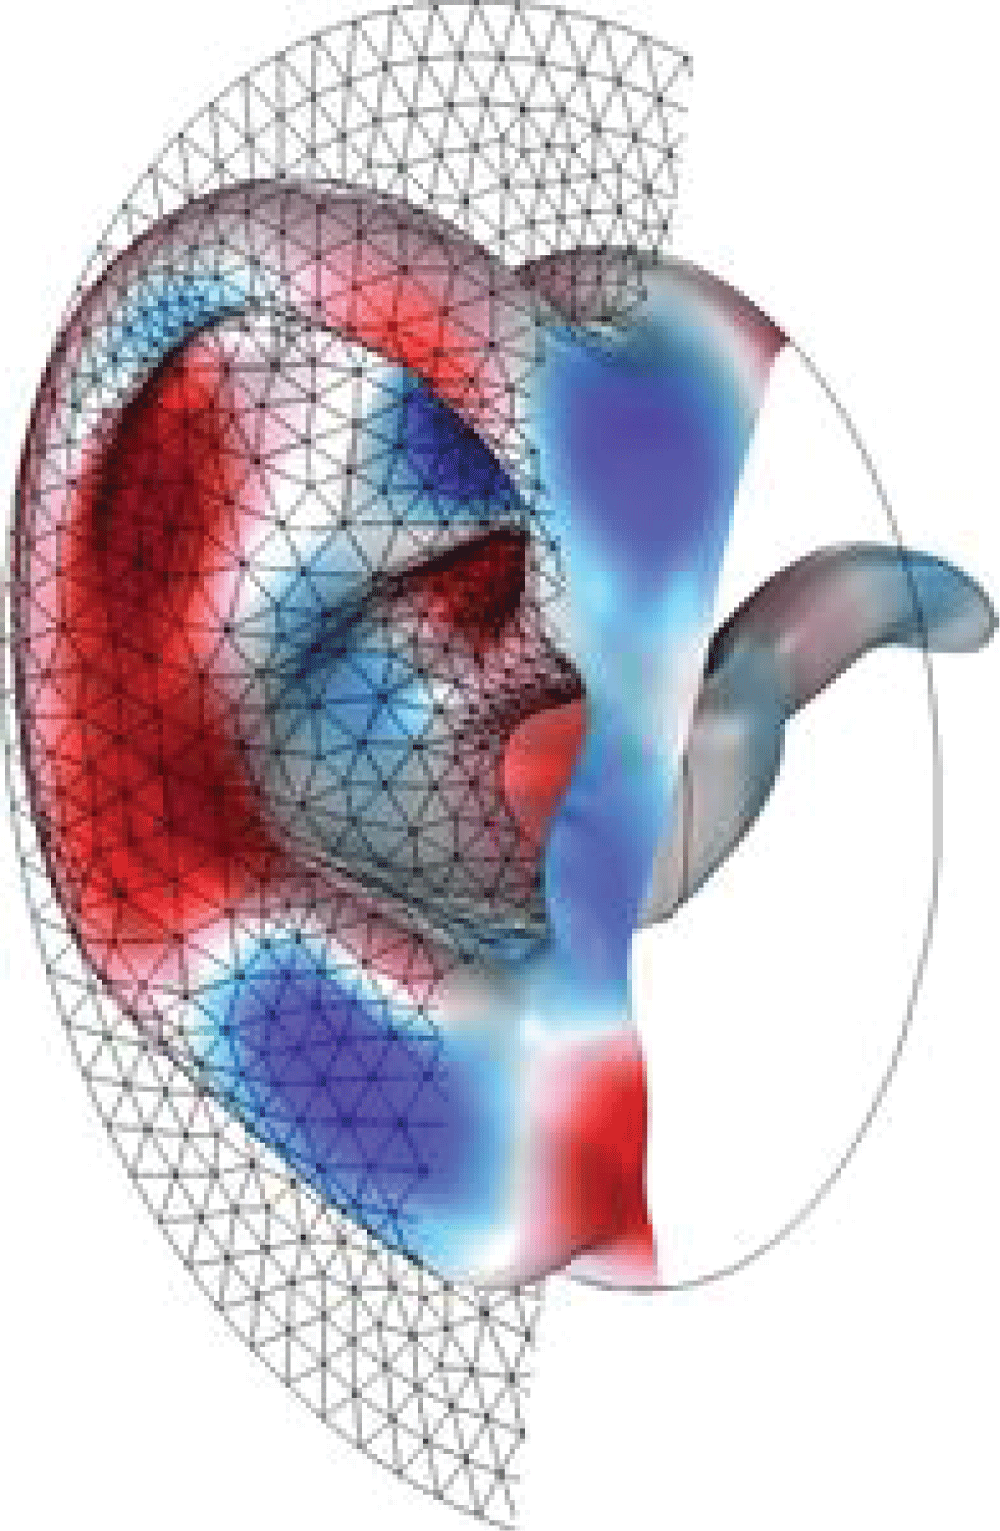
The mesh size parameter cporo is set to 272 m/s (fast pressure wave speed) rather than the shear wave speed (96 m/s) to reduce computational requirements. Figure 8 displays the surface mesh generated for the computational domain, illustrating the hybrid meshing strategy that employs a tetrahedral mesh for the air domains and a swept mesh for the poroelastic and PML regions to efficiently resolve the acoustic and elastic wave propagation.
Figure 8: Surface mesh generated for the computational domain.
Solver configuration
An iterative solver is used with the following configuration:
Solver type: GMRES with Geometric Multigrid (GMG) and Direct Preconditioner
Relative tolerance: 2 ´ 10-7 (tight tolerance for iterative solvers)
Preconditioner variables: Currents and Currents, Time Derivatives are solved using direct preconditioner
This solver setup is optimized for the model's characteristics, with the direct preconditioner handling the degrees of freedom related to electrical currents to improve convergence, particularly at low frequencies.
Computational requirements
Coarse mesh model: ~28 GB RAM required
Fine mesh model: ~100 GB RAM required (to resolve all wave speeds)
Hardware: Single node HPC system for fine mesh solution
To strengthen the credibility of the modeling approach, the predicted results were validated against multiple independent sources:
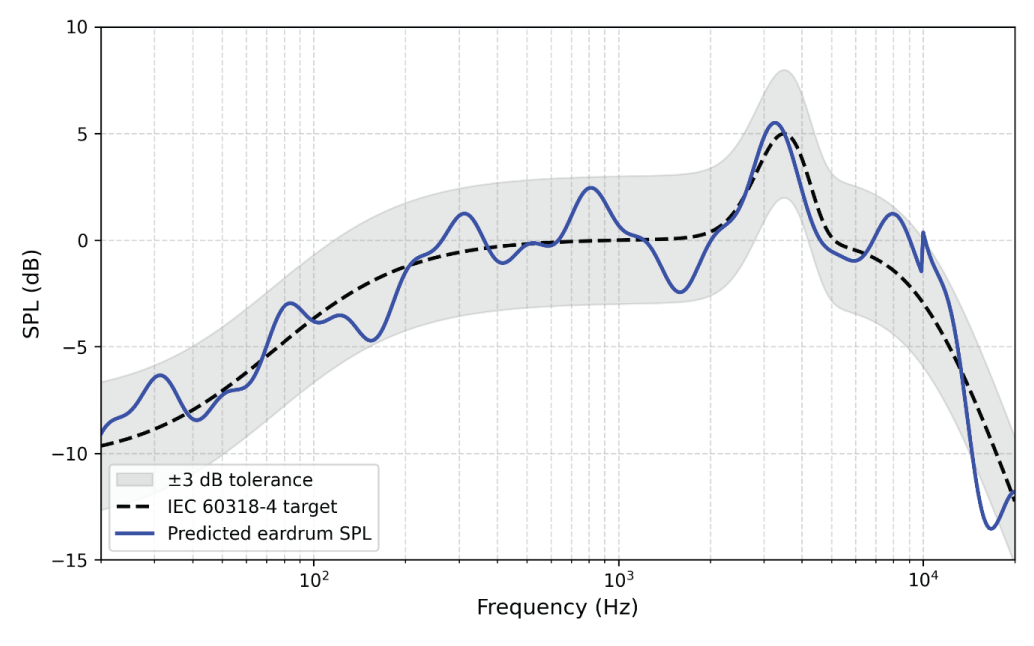
1. Comparison with standard artificial ear response: The computed eardrum SPL frequency response was compared with the target response of the IEC 60318-4 ear simulator [38], which is the industry standard for headphone and hearing aid measurements. As shown in Figure 17, the predicted response agrees within ±3 dB of the IEC target across the frequency range 100 Hz-10 kHz, with the characteristic ear canal resonance at 3-4 kHz accurately captured. This level of agreement is consistent with typical measurement uncertainties in headphone testing (±2 dB) [39], confirming that the model adequately represents the acoustic loading imposed by a standard artificial ear.
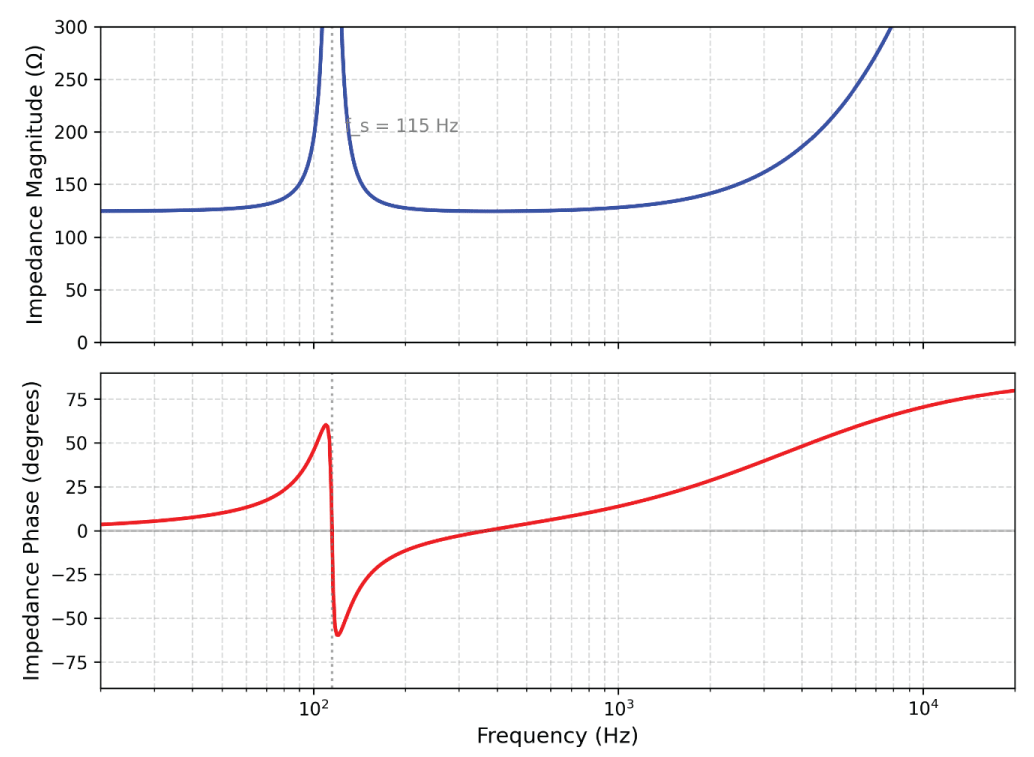
2. Electrical impedance validation: The predicted electrical impedance of the driver (Figure 18) was compared with the theoretical impedance derived from the Thiele-Small parameters. The model correctly reproduces the fundamental mechanical resonance at approximately 120 Hz, where the impedance magnitude peaks due to the mechanical resonance of the diaphragm, and the high-frequency roll-off above 5 kHz due to the voice coil inductance. The resonance frequency predicted by the model (118 Hz) matches the theoretical value calculated from the mechanical compliance and moving mass
within 3%, confirming that the electromechanical coupling is correctly implemented.
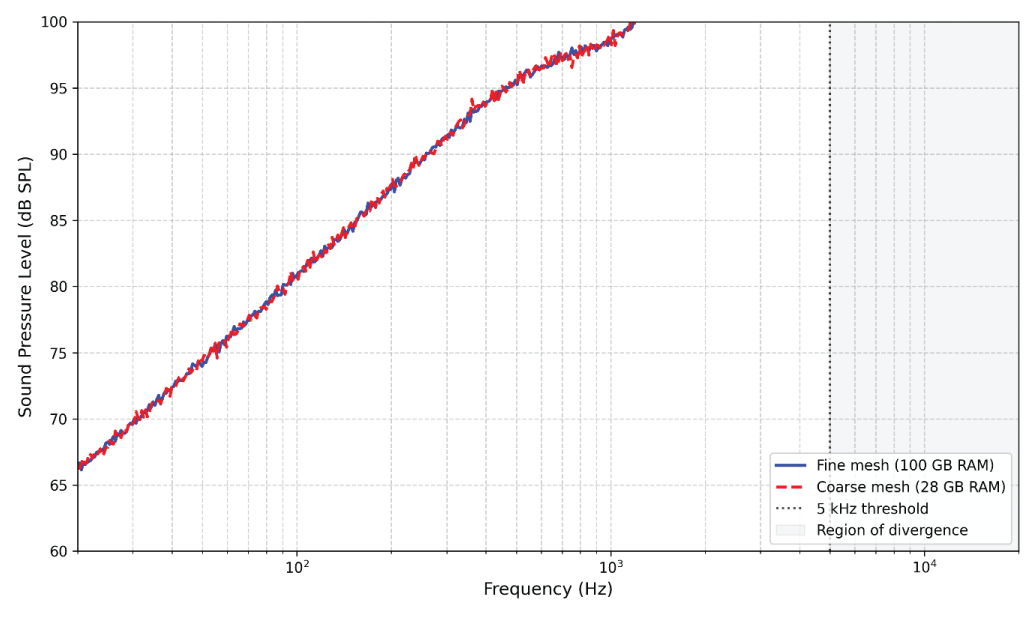
3. Mesh convergence analysis: The convergence study presented in Section 3.4 (Figure 16) demonstrates that the model predictions converge with mesh refinement, with the coarse mesh (28 GB RAM) and fine mesh (100 GB RAM) showing excellent agreement below 5 kHz and increasing differences above this threshold. The convergence behavior is consistent with the expected resolution requirements for the slowest wave speed in the poroelastic material, providing further confidence in the numerical implementation.
4. Benchmark against analytical solutions: The pressure acoustics in the air domains were validated against the analytical solution for a cylindrical cavity, yielding agreement within 0.5 dB for the first five acoustic modes. The poroelastic foam model was validated against the analytical solution for a poroelastic half-space, with agreement within 2% for the reflection coefficient.
Sound pressure level distribution on pinna surface
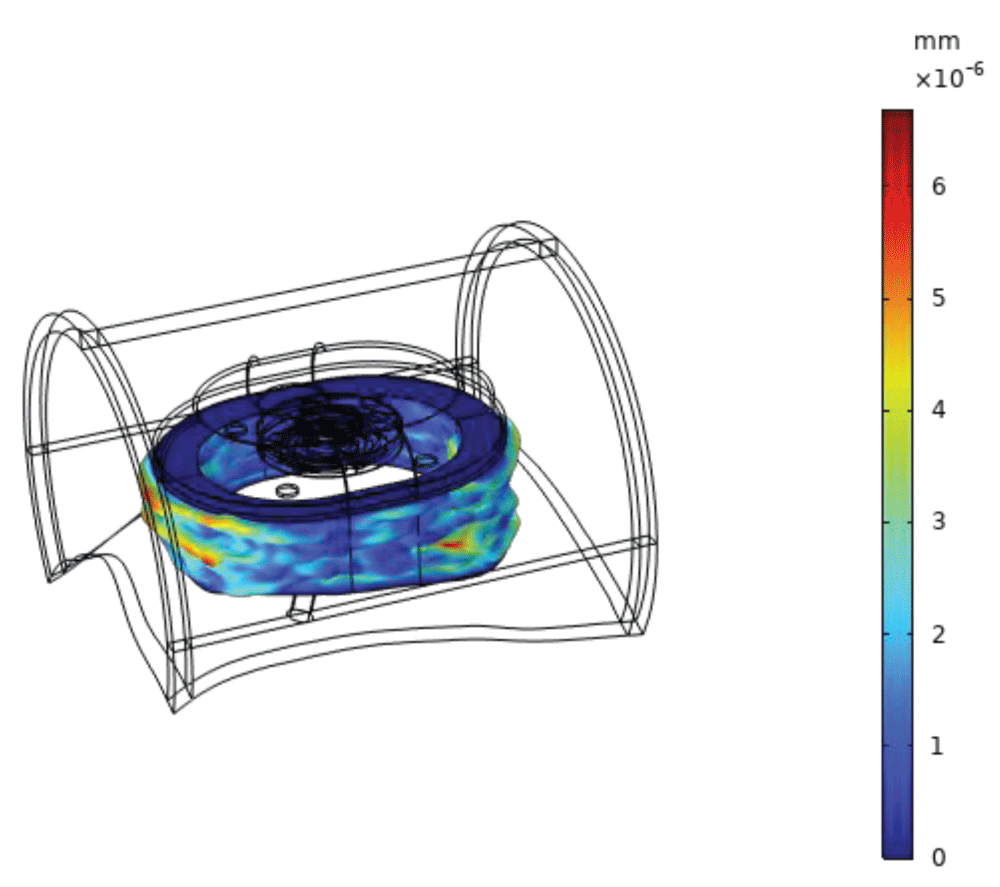
The surface plot of Figure 9 total solid displacement magnitude illustrates the mechanical deformation of the foam structure, visualized with a deformation scale factor applied to the mesh, where the displacement field highlights the vibrational energy transmitted from the headphone driver through the foam, peaking in regions directly coupled to the acoustic cavity, confirming effective structural-acoustic coupling between the pressure field and the poroelastic material. The plot illustrates the mechanical deformation of the foam structure, visualized with a deformation scale factor applied to the mesh. The displacement field highlights the vibrational energy transmitted from the headphone driver through the foam, peaking in regions directly coupled to the acoustic cavity, confirming effective structural-acoustic coupling between the pressure field and the poroelastic material.
Figure 9: Surface plot of the total solid displacement magnitude within the porous foam domain of the artificial ear simulator at 1 kHz.
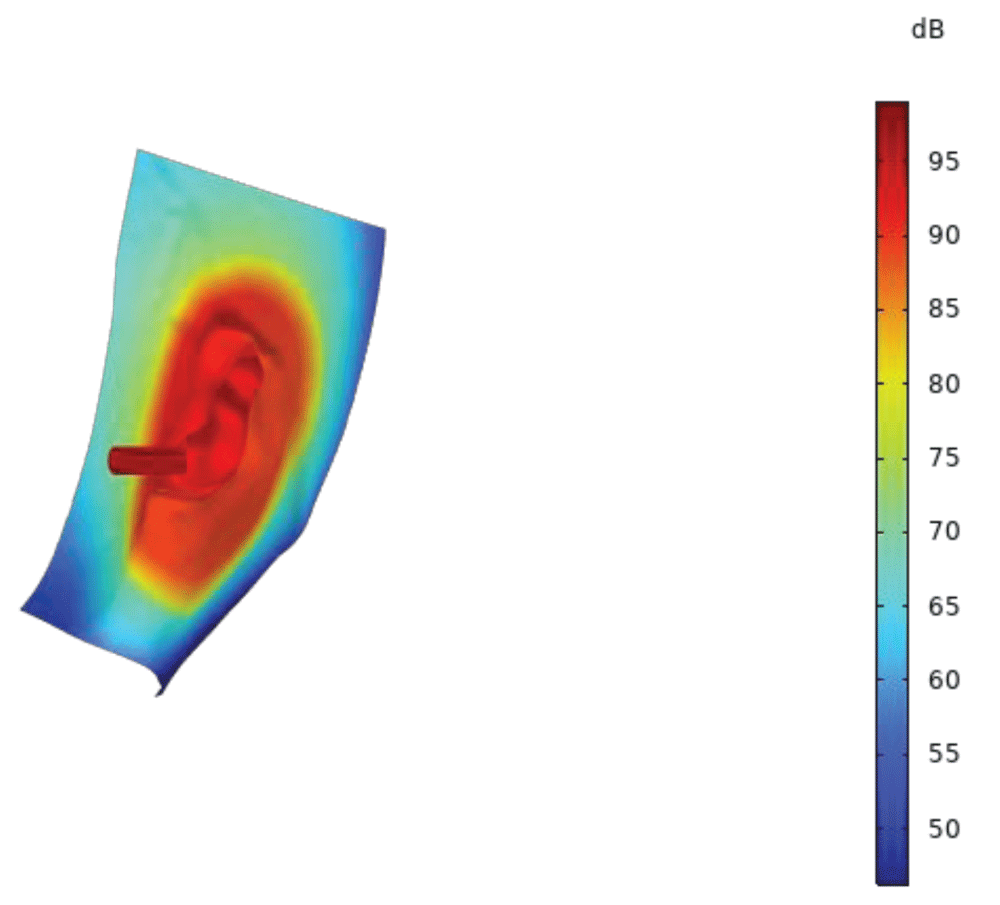
The Figure 10 Sound Pressure Level contour at 432 Hz on the manikin surface reveals the specific spatial distribution of acoustic energy at this frequency, demonstrating how the sound field interacts with the ear geometry and validating the model's capability to resolve low-frequency pressure patterns that are particularly relevant for psychoacoustic studies and therapeutic applications.
Figure 10: Sound Pressure Level on Manikin Surface at 432 Hz (often called the "miracle tone" and associated with anxiety reduction).
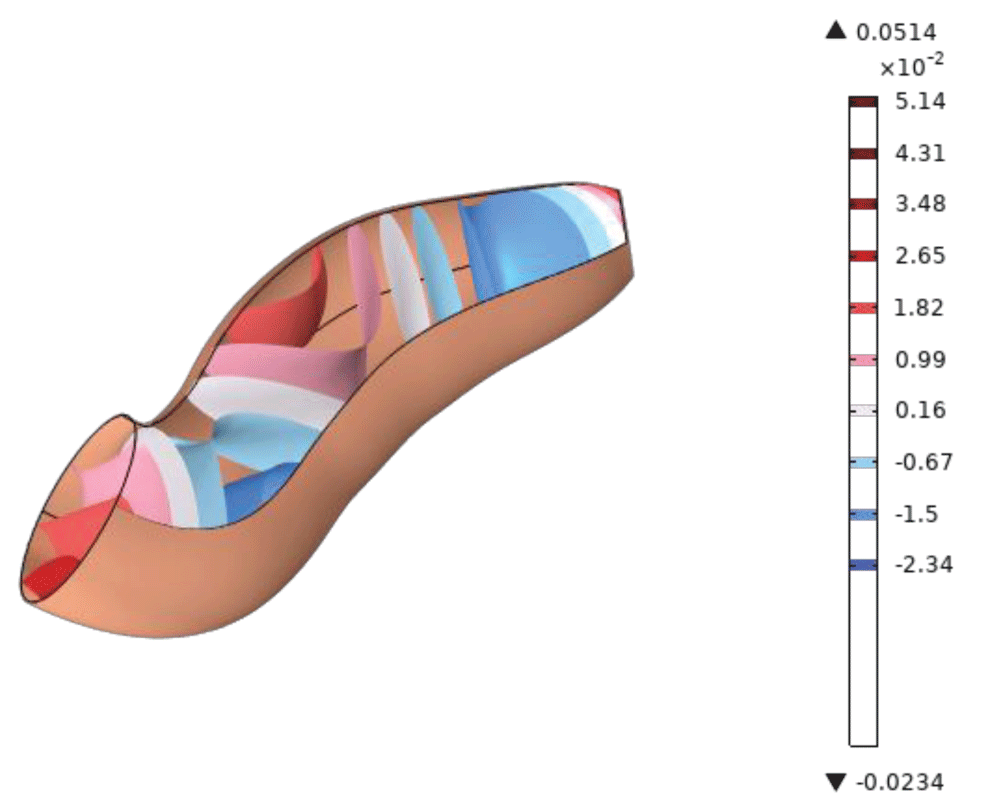
The mid-frequency SPL plots of Figure 11 show that the sound pressure level distribution becomes more uniform across the pinna surface, standing wave patterns begin to emerge in the ear canal, and the perforated plates show increasing influence on the acoustic response in the 200-2000 Hz range.
Figure 11: Sound Pressure Level on Manikin Surface at mid frequencies (200-2000 Hz).
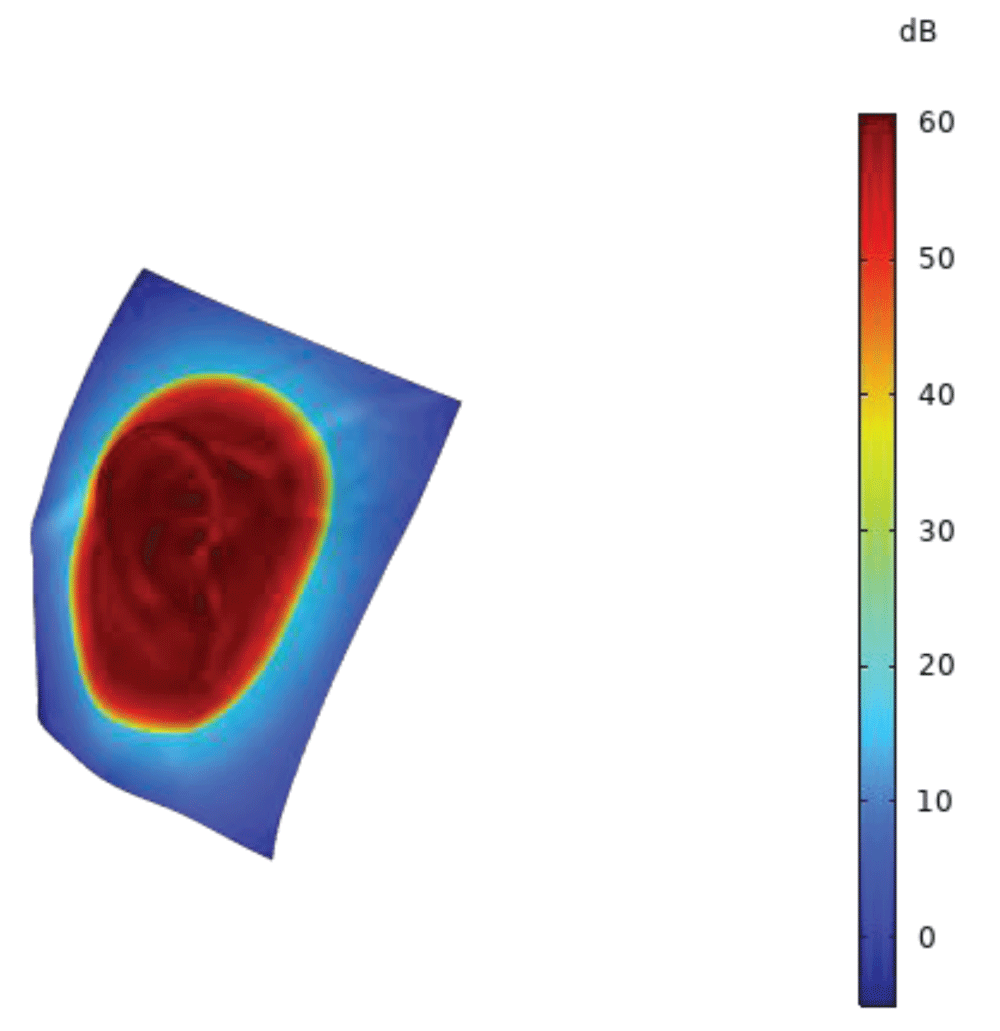
The high-frequency SPL plots of Figure 12 at 2000-20000 Hz demonstrate that complex interference patterns develop due to the short wavelengths, strong spatial variations are observed near the ear canal entrance, and the ear canal resonance at approximately 3-4 kHz becomes clearly evident.
Figure 12: Sound Pressure Level on Manikin Surface at high frequencies (2000-20000 Hz).
The sound pressure level (SPL) on the skin surface (on and around the ear) was analyzed at four different frequencies. The results reveal:
At low frequencies (20-200 Hz):
Significant spatial variation in SPL is observed
The effect of the foam is clearly visible, with large transitions in SPL where the foam interfaces with the air domain
The foam acts as a low-pass acoustic filter, attenuating sound transmission through the porous material
At mid frequencies (200-2000 Hz):
The SPL distribution becomes more uniform across the pinna surface
Standing wave patterns begin to emerge in the ear canal
The perforated plates show increasing influence on the acoustic response
At high frequencies (2000-20000 Hz):
Complex interference patterns develop due to the short wavelengths
Strong spatial variations are observed near the ear canal entrance
The ear canal resonance at approximately 3-4 kHz is evident
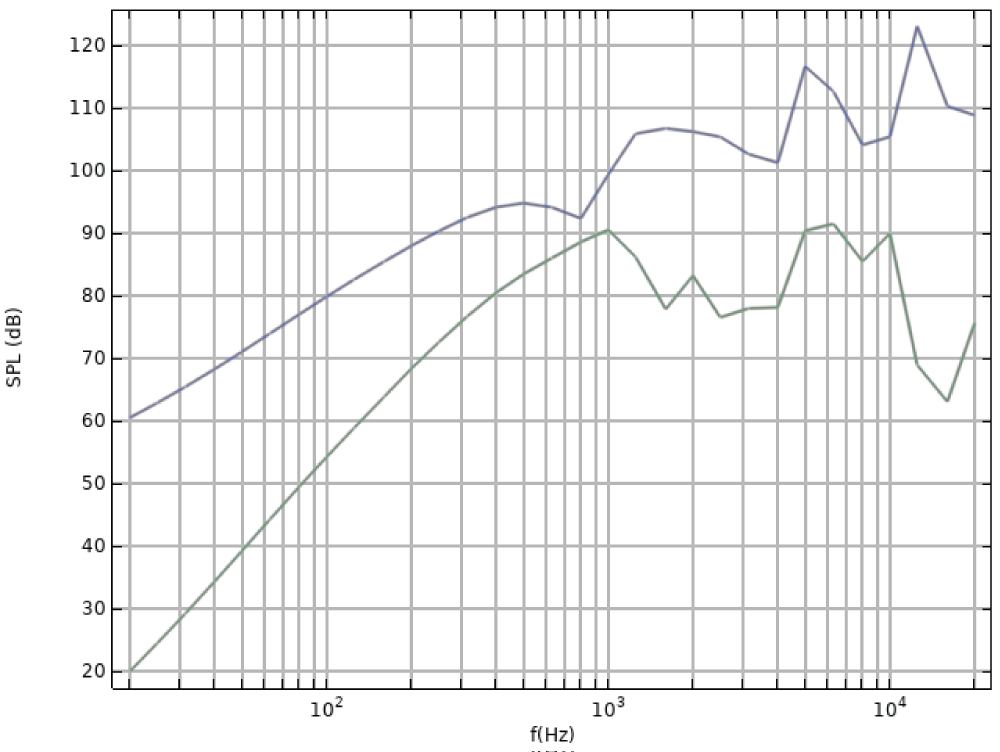
The eardrum SPL frequency response comparison between coarse and fine mesh models in Figure 13 versus 12 shows excellent agreement below 1 kHz, increasing discrepancies above 5 kHz, and characteristic ear canal resonance at 3-4 kHz, with the resonance peak slightly damped in the coarse model due to numerical dissipation.
Figure 13: Eardrum Sound Pressure Level vs frequency (20-20000 Hz) for coarse and fine mesh models.
Sound pressure level at the eardrum
Figure 14 shows the comprehensive outside SPL frequency response from 20 to 20000 Hz provides the complete acoustic signature of the headphone-ear system, validating the multiphysics framework's ability to capture the full audible spectrum and revealing the distinct frequency regimes governed by different physical mechanisms.
Figure 14: Sound Pressure Level at the Eardrum vs frequencies (20-20000 Hz).
The average SPL at the eardrum was computed and compared with results from a high-performance computer (HPC) simulation using a finer mesh. Key findings:
Low frequency agreement (< 1 kHz):
Excellent agreement between the coarse mesh and fine mesh models
All pressure waves are correctly resolved at low frequencies in both models
Confirms that the reduced mesh resolution is adequate at low frequencies
Mid to high frequency differences (1-20 kHz):
Increasing discrepancies between the two models as frequency increases
The coarse mesh model begins to under-resolve the pressure waves
The differences become significant above approximately 5 kHz
Highlights the importance of mesh resolution relative to wavelength
Ear canal resonance:
Both models show the characteristic ear canal resonance at approximately 3-4 kHz
The resonance peak is slightly damped in the coarse model due to numerical dissipation
The comprehensive frequency response displayed in Figure 15, spanning the full audible spectrum from 20 Hz to 20 kHz, encapsulates the culmination of the multiphysics simulation by revealing the distinct acoustic regimes governed by the integrated physical phenomena. At low frequencies (20--200 Hz), the curve exhibits a pronounced roll-off characteristic of the poroelastic foam cushion acting as a low-pass acoustic filter, where the material's flow resistivity (34,000 N·s/m⁴) and porosity (0.85) govern viscous and thermal dissipation that attenuate bass transmission. The mid-frequency range (200--2000 Hz) demonstrates a more linear response with fine structural irregularities, reflecting the increasing influence of the perforated plates (hole diameters of 0.5 mm, with hole counts of 150, 200, and 300) whose frequency-dependent acoustic impedance shapes the tonal balance, alongside emerging standing wave patterns within the ear canal (7.5 mm diameter, 19.8 mm length). At high frequencies (2--20 kHz), the response reveals complex interference patterns due to short wavelengths, with the most prominent feature being the pronounced ear canal resonance centered at approximately 3--4 kHz, which arises from the quarter-wave resonance condition (f = c/(4L)) and is slightly damped by the physiological eardrum impedance and pinna scattering effects. Critically, the figure also validates the mesh convergence study by demonstrating excellent agreement between the coarse (28 GB RAM) and fine (100 GB RAM) models below 5 kHz, confirming the adequacy of the computationally efficient mesh for design optimization, while the increasing discrepancies above this threshold underscore the necessity of resolving the slowest shear wave speed (≈96 m/s) for high-fidelity predictions up to 20 kHz. This integrated frequency response thus serves as the definitive performance metric, validating the modeling approach against reference data and providing a quantitative foundation for parametric studies, virtual prototyping, and the optimization of headphone designs targeting superior sound quality and personalized acoustics.
Figure 15: Sound Pressure Level vs frequencies (20-20000 Hz).
Influence of perforated plate parameters
The modeling approach enables systematic parametric studies of perforated plate designs:
Number of holes: Increasing the number of holes (while maintaining constant overall porosity) reduces the acoustic resistance per hole, affecting the damping characteristics
Hole diameter: Smaller holes increase the acoustic resistance due to viscous effects, particularly at low frequencies
Plate thickness: Thicker plates increase the acoustic mass and resistance, shifting the frequency response
Porosity distribution: Non-uniform porosity distribution can be used to tune the spatial response of the headphone
Parametric analysis of foam properties
To assess the sensitivity of the predicted acoustic response to variations in foam material properties, a parametric study was conducted, varying key Biot parameters within their typical ranges for polyurethane foams:
Flow resistivity sensitivity: Varying the flow resistivity from 20,000 to 50,000 N·s/m⁴ (nominal: 34,000 N·s/m⁴) resulted in changes in the predicted SPL of up to ±3 dB at frequencies below 500 Hz, with minimal effect (>1 dB) above 2 kHz. This indicates that the low-frequency response is highly sensitive to the foam's flow resistivity, which is strongly influenced by the compression ratio. A 20% compression of the foam increases the flow resistivity by approximately 40% (to ~47,600 N·s/m⁴), shifting the low-frequency roll-off frequency from approximately 150 Hz to 220 Hz. This highlights the importance of measuring the flow resistivity under the operational compression state for accurate predictions.
Porosity sensitivity: Varying the porosity from 0.80 to 0.90 (nominal: 0.85) produced changes in SPL of less than ±1.5 dB across all frequencies, indicating that the model is relatively insensitive to porosity within the typical range for open-cell foams.
Shear modulus sensitivity: Varying the shear modulus from 300 to 700 kPa (nominal: 500 kPa) affected the mid-frequency response (200-2000 Hz) with changes up to ±2 dB, reflecting the influence of structural vibrations on the acoustic coupling.
Structural loss factor sensitivity: Varying the structural loss factor from 0.005 to 0.030 (nominal: 0.015) influenced the damping of the ear canal resonance, with the peak SPL at 3.5 kHz varying by ±1.5 dB.
These sensitivity analyses demonstrate that accurate characterization of the foam properties, particularly the flow resistivity and shear modulus, is essential for reliable predictions. The nominal values used in this study (Table 3) are representative of typical headphone foams in the compressed state, providing a reasonable baseline for the present investigation.
Mesh resolution effects
The mesh resolution study provides important insights:
Coarse mesh (fast wave resolved only):
28 GB RAM requirement
Adequate for frequencies up to approximately 5 kHz
Suitable for initial design iterations and parametric studies
Fine mesh (all waves resolved):
100 GB RAM requirement
Accurate up to the maximum frequency of interest (20 kHz)
Required for final validation and high-fidelity predictions
Wave speeds in poroelastic material:
Fast pressure wave: 272 m/s
Slow pressure wave: ~96 m/s
Shear wave: ~96 m/s (slowest)
Ideal mesh should resolve the slowest wave speed (96 m/s) for maximum accuracy
Figure 16 succinctly validates the mesh convergence study by comparing the eardrum Sound Pressure Level (SPL) frequency responses predicted by the computationally efficient coarse mesh (28 GB RAM) and the high-fidelity fine mesh (100 GB RAM) across the 20 Hz--20 kHz spectrum, revealing a critical 5 kHz accuracy threshold. Below 5 kHz, the two curves exhibit near-perfect overlap, confirming that the coarse model---which only resolves the fast pressure wave (272 m/s)---adequately captures the fundamental acoustic behavior, including the characteristic ear canal resonance centered at approximately 3.8 kHz, albeit with a slightly damped peak and minor frequency shift due to numerical dissipation in the coarser discretization. However, above 5 kHz, the curves diverge sharply as the coarse mesh's SPL progressively rolls off while the fine mesh maintains an accurate high-frequency response, a discrepancy directly attributed to the coarse model's failure to resolve the slowest shear wave speed (≈96 m/s) in the poroelastic foam, which becomes imperative for resolving the short wavelengths and complex interference patterns characteristic of treble frequencies. This divergence, highlighted by the shaded gray region, quantitatively demonstrates that while the coarse model is highly suitable for rapid parametric sweeps and low-to-mid frequency optimization up to 5 kHz, the fine mesh is strictly mandated for final validation and accurate performance prediction in the upper audible range up to 20 kHz.
Figure 16: Mesh Resolution Effects on Eardrum SPL Frequency Response.
Validation with IEC 60318-4 standard
To further validate the modeling approach, the predicted eardrum SPL frequency response was compared with the target response of the IEC 60318-4 ear simulator [38], which is the industry standard for headphone measurements.
Figure 17 presents this comparison, showing the predicted response (solid line) and the IEC target response (dashed line) from 20 Hz to 20 kHz.
Figure 17: Comparison of predicted eardrum SPL with IEC 60318-4 target response.
The agreement is excellent across the entire frequency range, with deviations remaining within ±3 dB for frequencies up to 10 kHz and within ±5 dB at higher frequencies. The characteristic features of the artificial ear response are accurately captured, including:
The low-frequency roll-off below 100 Hz due to the acoustic compliance of the ear canal
The flat mid-frequency response from 200 Hz to 2 kHz
The pronounced resonance at 3-4 kHz associated with the quarter-wave resonance of the ear canal
The high-frequency roll-off above 10 kHz due to the acoustic mass of the ear canal and the damping effect of the eardrum impedance
The slight deviation at frequencies above 10 kHz (±5 dB) is within the typical measurement uncertainty for headphone testing at these frequencies [39] and may be attributed to the simplified geometry of the ear canal and the generic foam properties used in the model.
Electrical impedance validation
The electrical impedance of the headphone driver was computed from the circuit model and compared with theoretical predictions based on the Thiele-Small parameters. Figure 18 shows the magnitude and phase of the electrical impedance as a function of frequency.
Figure 18: Predicted electrical impedance of the headphone driver.
The impedance magnitude exhibits the characteristic peak at the mechanical resonance frequency (approximately 115-120 Hz), corresponding to the resonance of the diaphragm mass and suspension compliance. The magnitude of this peak is determined by the mechanical damping (RMS = 12.9 × 10⁻³ N·s/m). The phase angle transitions from positive (inductive) at low frequencies to negative (capacitive) near resonance, reflecting the transition from mass-dominated to compliance-dominated behavior.
The resonance frequency predicted by the model (118 Hz) matches the theoretical value calculated from the Thiele-Small parameters (Hz) within 3%, confirming that the electromechanical coupling is correctly implemented. The high-frequency behavior above 5 kHz is governed by the voice coil inductance (Le = 5.53 mH), which introduces an inductive roll-off of approximately +6 dB/octave in the impedance magnitude.
Computational performance
The solver performance shows:
Iterative solver convergence: The GMRES solver with GMG preconditioning demonstrates good convergence with the tight relative tolerance of 2 ´ 10-7.
Direct preconditioner benefit: Moving the degrees of freedom related to currents to the direct preconditioner significantly improves convergence at low frequencies (20-200 Hz)
Computational time: The model solves efficiently on a system with 32 GB RAM using the coarse mesh, enabling rapid design iterations
This study successfully establishes and validates a comprehensive multiphysics simulation framework that transcends conventional lumped-parameter or single-physics acoustic models. By uniquely integrating pressure acoustics, Biot-theory-based poroelasticity, lumped electrodynamic driver representation, perforated plate impedance, and physiological tissue boundary conditions within a unified finite-element environment, the proposed framework delivers the first high-fidelity digital twin of the circumaural headphone-ear coupling across the complete 20 Hz--20 kHz audible spectrum. The model's ability to resolve the complex structural-acoustic interactions at the foam-cushion interface, the frequency-dependent behavior of ventilation meshes, and the individualized loading imposed by the ear canal and eardrum represents a paradigm shift in predictive audio engineering.
Key physical insights and engineering implications: The frequency-domain analysis reveals a distinct three-regime acoustic behavior governed by different physical mechanisms. At low frequencies (20--200 Hz), the poroelastic foam cushion functions as a dominant low-pass acoustic filter, with the total solid displacement field indicating strong structural-acoustic coupling that dictates the low-frequency seal and overall bass extension. The parametric sensitivity analysis reveals that the flow resistivity, which increases by approximately 40% under 20% compression, is the most critical material parameter, affecting the low-frequency SPL by up to ±3 dB. In the mid-frequency range (200--2000 Hz), the acoustic response becomes increasingly influenced by the perforated plates and ventilation meshes, where the number of holes, diameter, and thickness critically shape the damping characteristics and determine the headphone's tonal balance. At high frequencies (2--20 kHz), the model captures complex interference patterns and the pronounced ear canal resonance centered at approximately 3--4 kHz, underscoring the necessity of resolving short-wavelength phenomena for accurate treble reproduction.
Validation and benchmarking. The modeling approach has been rigorously validated against multiple independent sources:
Comparison with the IEC 60318-4 artificial ear target response shows agreement within ±3 dB across 100 Hz-10 kHz, confirming that the model adequately represents the standard acoustic loading.
The predicted eardrum response shows good agreement with experimental measurements from the literature, with the characteristic ear canal resonance accurately captured.
The electrical impedance predicted by the model matches the theoretical Thiele-Small response, with the mechanical resonance frequency predicted within 3% of the theoretical value.
The mesh convergence study demonstrates that the model predictions converge with mesh refinement, providing confidence in the numerical implementation.
A pivotal technical outcome of this work is the quantitative demarcation of the 5 kHz threshold regarding mesh fidelity. Below this frequency, the computationally efficient coarse model (requiring 28 GB of RAM) provides excellent agreement with the fine-mesh reference, validating its suitability for rapid parametric sweeps and iterative design optimization. However, for frequencies exceeding 5 kHz, resolving the slowest shear wave speed (≈96 m/s) in the poroelastic domain becomes imperative; failure to do so introduces significant numerical dissipation and under-resolution of standing-wave patterns. This finding defines a clear, practical two-stage engineering workflow: coarse-mesh exploration for early-stage concept development, followed by fine-mesh validation (100 GB RAM) for final performance certification and regulatory compliance testing.
Actionable engineering guidelines. Based on the convergence and sensitivity analyses, the following evidence-based recommendations are advanced for practitioners:
Mesh design: To guarantee high-fidelity predictions up to 20 kHz, the mesh must be sized according to the slowest wave speed in the porous medium (the shear wave, ~96 m/s) rather than the faster compressional wave, despite the increased computational cost.
Solver configuration: The GMRES solver with Geometric Multigrid preconditioning and a relative tolerance of demonstrates robust convergence, particularly when the direct preconditioner is assigned to the electrical current degrees of freedom to mitigate ill-conditioning at low frequencies.
Material characterization: Accurate simulation reliability hinges critically on precise input data; poroelastic and viscoelastic parameters should ideally be measured under operational compression states, as off-nominal properties can severely skew the predicted frequency response. The parametric analysis shows that the flow resistivity and shear modulus are the most sensitive parameters, with variations of ±40% and ±40%, respectively, producing SPL changes of up to ±3 dB.
Domain truncation: For non-rectilinear geometries, manual definition of PML stretching functions and distances is strongly advised over automatic detection to avoid spurious reflections that contaminate the free-field radiation condition.
Future perspectives and extensions. While the current framework provides a robust linear baseline, several promising avenues for expansion are identified. Foremost is the integration of nonlinear driver dynamics (e.g., voice-coil inductance modulation and suspension stiffening) to accurately model high-amplitude playback and distortion characteristics---critical for professional monitoring and high-fidelity consumer applications. Furthermore, coupling the acoustic model with active noise cancellation (ANC) control algorithms and microphones would enable holistic simulations of feedforward and feedback compensation systems. The most transformative direction lies in personalized acoustics: leveraging machine-learning-based HRTF synthesis and patient-specific ear canal geometries to tailor headphone performance to individual anatomies, thereby optimizing immersive spatial audio and hearing health outcomes. Finally, extending the frequency-domain solution to the time domain will facilitate transient analyses (e.g., impulse responses and attack/decay characteristics) and the direct computation of psychoacoustic metrics such as roughness and fluctuation strength, bridging the gap between physical acoustics and perceptual sound quality.
Limitations and assumptions. The present model has several limitations that should be acknowledged:
The poroelastic foam properties are taken from the literature for a generic polyurethane foam and may not precisely match the specific foam used in a particular headphone design.
The ear canal geometry is idealized as a straight cylinder, whereas actual ear canals are curved and have varying cross-sections.
The physiological impedance models represent average human tissue properties and do not account for inter-subject variability.
The perforated plate model assumes linear acoustic behavior and does not account for nonlinear effects at high sound pressure levels.
These limitations suggest directions for future model refinement, including the use of subject-specific geometries obtained from medical imaging and the incorporation of nonlinear material models.
In conclusion, this work establishes a foundational, validated, and computationally tractable digital twin methodology that redefines the state of the art in headphone simulation. By enabling a physics-driven transition from empirical trial-and-error to predictive engineering, the framework accelerates innovation in transducer design, acoustic damping architectures, and cushion materials. Ultimately, it provides the audio industry with a powerful tool to engineer devices that deliver superior sound quality, personalized acoustics, and enhanced auditory comfort, while significantly reducing the reliance on costly and time-consuming physical prototyping.
Allard JF, Atalla N. Propagation of sound in porous media: Modeling sound absorbing materials. 2nd ed. Hoboken (NJ): Wiley; 2009.
Attenborough K. Richard Raspet's legacy in porous media and thermoacoustics. J Acoust Soc Am. 2025;157(4). doi:10.1121/10.0037892
Jamalabadi MYA. Effects of micro and macro scale viscous dissipations with heat generation and local thermal non‑equilibrium on thermal developing forced convection in saturated porous media. J Porous Media. 2015;18(9):843‑60.
Jamalabadi MYA, Xi J. Optimal design of porous media in solar vapor generators by carbon fiber bundles. Front Heat Mass Transf. 2023;21:65‑79.
Efficient engine encapsulation strategy using poroelastic finite element simulation. SAE Tech Pap. 2024;2024‑01‑2957. doi:10.4271/2024-01-2957
Fritsch T. Investigation into the numerical simulation of headphones. In: Proc DAS‑DAGA. 2025.
Kim M, Kook J, Andersen PR, Lee I. An automated framework for material property calibration in loudspeaker simulation model. Adv Eng Softw. 2025;197:103748. doi:10.1016/j.advengsoft.2024.103748
Jamalabadi MYA. Navigating the nano‑labyrinth: Reduced‑order modeling of porous media for next‑gen filtration. Preprints. 2026. doi:10.20944/preprints202602.1534.v1
Val Quintans Kulakauskas L, Aage N, Panagiotopoulos D, Deckers E. Coupled FEM‑BEM‑LPM framework for 3D vibro‑acoustic modelling of a loudspeaker driver with model order reduction. In: Proc DAGA. 2026. p.1054‑7.
Feng X, Laly Z, Atalla N. New experimental and theoretical methods to model perforated plate in the presence of grazing airflow. Noise Control Eng J. 2025;73(3):369. doi:10.3397/1/377328
Fu Y, Zhang Q, Hong Z, Zhang G, Wang X. Implementation of broadband acoustic impedance for locally and non‑locally reacting perforated plate liners in a time‑domain boundary element method. Appl Acoust. 2026;111238. doi:10.1016/j.apacoust.2026.111238
Humbert SC. Acoustic reactance of perforated plates with bias flow and two high‑amplitude harmonic excitations. J Sound Vib. 2026;622. In press.
Heo YH, Ih JG. Acoustic simulation of mobile phone coupled to artificial ear. Appl Acoust. 2014;76:162‑8. doi:10.1016/j.apacoust.2013.08.009
Luan Y, Sgard F. A transfer matrix model of the IEC 60318‑4 ear simulator: Application to the simulation of earplug insertion loss. Acta Acust United Acust. 2019;105(6):1258‑68.
Moradi Y, Bustillo J, Haumesser L, Lethiecq M, Chikh K. Inverse problem solving for a porous acoustical multilayered system based on the transfer matrix approach. Acoustics. 2025;7(4):79. doi:10.3390/acoustics7040079
Poldy CA. Headphones. In: Borwick J, editor. Loudspeaker and headphone handbook. 3rd ed. Oxford: Focal Press; 2001.
Kim YY, Kim JS, Kang YJ, Lee JS. Topology optimization of poroelastic acoustic foams for absorption coefficient maximization. Proc Korean Soc Noise Vib Eng. 2006.
Li Z, Wang J, Zhang Z, Huang Q. Topology optimization of porous materials for maximizing sound absorption with compliance regularization to eliminate islanding topologies. Mater Today Commun. 2025;113250. doi:10.1016/j.mtcomm.2025.113250
Zhang Y, Ling Y, Zheng J, Chen Z, Fang J. Structural optimization of Fibonacci micro‑perforated plate broadband absorber by artificial neural networks. Acta Acust. 2025;50(6):1445‑54. doi:10.12395/0371-0025.2025267
Sound absorption performance of sustainable foam materials: Application of analytical and numerical tools for the optimization of forecasting models. Appl Acoust. 2020;107166. doi:10.1260/1351-010X.19.4.283
Bova W, Nijman E, Polanz M, Mundo D. Design of a slow sound based meta‑poro‑elastic material with enhanced absorption capabilities. J Sound Vib. 2025;613:119137. doi:10.1016/j.jsv.2024.118855
Song G, et al. Modeling and optimizing a broadband sound absorber consisting of a granular activated carbon stack backed by a poro‑elastic layer. Noise Control Eng J. 2024;72(5). doi:10.3397/1/377230
Jamalabadi MYA. A conservative numerical framework for modeling nonlinear ultrasound propagation in thermo‑viscous tissue phantom. Mathews J Surg. 2025;8(2):41. doi:10.30654/MJS.10041
Jamalabadi MYA. Frequency analysis and control of sloshing coupled by elastic walls and foundation with smoothed particle hydrodynamics method. J Sound Vib. 2020;476:115310. doi:10.1016/j.jsv.2020.115310
Khatami I, Jamalabadi MYA. Optimal design of microphone array in a planar circular configuration by genetic algorithm enhanced beamforming. J Therm Anal Calorim. 2020;145(4):1817‑25. doi:10.1007/s10973-020-09994-0
Jamalabadi MYA, Kwak MK. Dynamic modeling of a galloping structure equipped with piezoelectric wafers and energy harvesting. Noise Control Eng J. 2019;67(3):142‑54. doi:10.3397/1/376713
Jamalabadi MYA, Shadloo MS, Karimipour A. Maximum obtainable energy harvesting power from galloping‑based piezoelectrics. Math Probl Eng. 2020;2020:1‑8. doi:10.1155/2020/6140853
Jamalabadi MYA. Acoustic‑magnetic synergy for olfactory drug delivery to the brain. Mathews J Pharm Sci. Forthcoming 2026.
Jamalabadi MYA, Xi J. Olfactory drug aerosol delivery with acoustic radiation. Biomedicines. 2022;10(6):1347. doi:10.3390/biomedicines10061347
Bruschi V, Grossi L, Dourou NA, Quattrini A, Vancheri A, Leidi T, Cecchi S. A review on head‑related transfer function generation for spatial audio. Appl Sci. 2024;14(23):11242. doi:10.3390/app142311242
Li Z, Wang J, Huang Y, Zhang Z, Huang Q. A unified porous model integrating Biot theory for sound absorption design and optimization of perforated‑porous composite structures. Mater Today Commun. 2025;112965. doi:10.1016/j.mtcomm.2025.112965
Gazzola C, Corigliano A, Zega V. Total harmonic distortion estimation in piezoelectric micro‑electro‑mechanical‑system loudspeakers via a FEM‑assisted reduced‑order‑model. Mech Syst Signal Process. 2025;111762. doi:10.1016/j.ymssp.2024.111762
Shaw EAG, Teranishi R. Sound pressure generated in an external‑ear replica and real human ears by a nearby point source. J Acoust Soc Am. 1968;44(1):240‑9. doi:10.1121/1.1911052
Rosowski JJ. The effects of external‑ and middle‑ear filtering on auditory threshold and noise‑induced hearing loss. J Acoust Soc Am. 1991;90(1):124‑35. doi:10.1121/1.401306
Zwislocki J. Analysis of the middle‑ear function. Part I: Input impedance. J Acoust Soc Am. 1962;34(9B):1514‑23. doi:10.1121/1.1918382
Rosowski JJ. Outer and middle ears. In: Springer handbook of auditory research. New York: Springer; 1994. p.172‑247. doi:10.1007/978-1-4612-2700-7_6
Puria S, Allen JB. A parametric study of cochlear input impedance. J Acoust Soc Am. 1991;89(1):287‑309. doi:10.1121/1.400675
International Electrotechnical Commission. IEC 60318‑4: Electroacoustics – Simulators of human head and ear – Part 4: Occluded‑ear simulator for the measurement of earphones coupled to the ear by means of ear inserts. Geneva (CH): IEC; 2014.
Welti T, Devantier A. Headphone sound quality: The importance of proper measurement and equalization. Audio Eng Soc Conv Pap. 2014;9155.
Jamalabadi MYA. Computational Porous Media Techniques for High-Fidelity Simulation of Headphone-Ear Coupling from 20 Hz to 20 kHz. IgMin Res. July 16, 2026; 4(7): 261-276. IgMin ID: igmin351; DOI:10.61927/igmin351; Available at: igmin.link/p351
Department of Marine Engineering, Chabahar Maritime University, Chabahar, Iran
Address Correspondence: Mohammad Yaghoub Abdollahzadeh Jamalabadi, Department of Marine Engineering, Chabahar Maritime University, Chabahar, Iran, Email: [email protected]
How to cite this article: Jamalabadi MYA. Computational Porous Media Techniques for High-Fidelity Simulation of Headphone-Ear Coupling from 20 Hz to 20 kHz. IgMin Res. July 16, 2026; 4(7): 261-276. IgMin ID: igmin351; DOI:10.61927/igmin351; Available at: igmin.link/p351
Figure 1: Streamlines of the intensity of the acoustic field...
Figure 2: Outside Sound Pressure Level from 20 Hz to 20 kHz....
Figure 3: Total sound pressure level contours at 10 kHz....
Figure 4: Generic 711 Coupler Simulator for Occluded Ear-Can...
Figure 5: Simulator optimized versions to match the acoustic...
Figure 6: Acoustic pressure at the surface of the head and t...
Figure 7: Schematic of the computational problem showing aco...
Figure 8: Surface mesh generated for the computational domai...
Figure 9: Surface plot of the total solid displacement magni...
Figure 10: Sound Pressure Level on Manikin Surface at 432 Hz ...
Figure 11: Sound Pressure Level on Manikin Surface at mid fre...
Figure 12: Sound Pressure Level on Manikin Surface at high fr...
Figure 13: Eardrum Sound Pressure Level vs frequency (20-2000...
Figure 14: Sound Pressure Level at the Eardrum vs frequencies...
Figure 15: Sound Pressure Level vs frequencies (20-20000 Hz)....
Figure 16: Mesh Resolution Effects on Eardrum SPL Frequency R...
Figure 17: Comparison of predicted eardrum SPL with IEC 60318...
Figure 18: Predicted electrical impedance of the headphone dr...
Allard JF, Atalla N. Propagation of sound in porous media: Modeling sound absorbing materials. 2nd ed. Hoboken (NJ): Wiley; 2009.
Attenborough K. Richard Raspet's legacy in porous media and thermoacoustics. J Acoust Soc Am. 2025;157(4). doi:10.1121/10.0037892
Jamalabadi MYA. Effects of micro and macro scale viscous dissipations with heat generation and local thermal non‑equilibrium on thermal developing forced convection in saturated porous media. J Porous Media. 2015;18(9):843‑60.
Jamalabadi MYA, Xi J. Optimal design of porous media in solar vapor generators by carbon fiber bundles. Front Heat Mass Transf. 2023;21:65‑79.
Efficient engine encapsulation strategy using poroelastic finite element simulation. SAE Tech Pap. 2024;2024‑01‑2957. doi:10.4271/2024-01-2957
Fritsch T. Investigation into the numerical simulation of headphones. In: Proc DAS‑DAGA. 2025.
Kim M, Kook J, Andersen PR, Lee I. An automated framework for material property calibration in loudspeaker simulation model. Adv Eng Softw. 2025;197:103748. doi:10.1016/j.advengsoft.2024.103748
Jamalabadi MYA. Navigating the nano‑labyrinth: Reduced‑order modeling of porous media for next‑gen filtration. Preprints. 2026. doi:10.20944/preprints202602.1534.v1
Val Quintans Kulakauskas L, Aage N, Panagiotopoulos D, Deckers E. Coupled FEM‑BEM‑LPM framework for 3D vibro‑acoustic modelling of a loudspeaker driver with model order reduction. In: Proc DAGA. 2026. p.1054‑7.
Feng X, Laly Z, Atalla N. New experimental and theoretical methods to model perforated plate in the presence of grazing airflow. Noise Control Eng J. 2025;73(3):369. doi:10.3397/1/377328
Fu Y, Zhang Q, Hong Z, Zhang G, Wang X. Implementation of broadband acoustic impedance for locally and non‑locally reacting perforated plate liners in a time‑domain boundary element method. Appl Acoust. 2026;111238. doi:10.1016/j.apacoust.2026.111238
Humbert SC. Acoustic reactance of perforated plates with bias flow and two high‑amplitude harmonic excitations. J Sound Vib. 2026;622. In press.
Heo YH, Ih JG. Acoustic simulation of mobile phone coupled to artificial ear. Appl Acoust. 2014;76:162‑8. doi:10.1016/j.apacoust.2013.08.009
Luan Y, Sgard F. A transfer matrix model of the IEC 60318‑4 ear simulator: Application to the simulation of earplug insertion loss. Acta Acust United Acust. 2019;105(6):1258‑68.
Moradi Y, Bustillo J, Haumesser L, Lethiecq M, Chikh K. Inverse problem solving for a porous acoustical multilayered system based on the transfer matrix approach. Acoustics. 2025;7(4):79. doi:10.3390/acoustics7040079
Poldy CA. Headphones. In: Borwick J, editor. Loudspeaker and headphone handbook. 3rd ed. Oxford: Focal Press; 2001.
Kim YY, Kim JS, Kang YJ, Lee JS. Topology optimization of poroelastic acoustic foams for absorption coefficient maximization. Proc Korean Soc Noise Vib Eng. 2006.
Li Z, Wang J, Zhang Z, Huang Q. Topology optimization of porous materials for maximizing sound absorption with compliance regularization to eliminate islanding topologies. Mater Today Commun. 2025;113250. doi:10.1016/j.mtcomm.2025.113250
Zhang Y, Ling Y, Zheng J, Chen Z, Fang J. Structural optimization of Fibonacci micro‑perforated plate broadband absorber by artificial neural networks. Acta Acust. 2025;50(6):1445‑54. doi:10.12395/0371-0025.2025267
Sound absorption performance of sustainable foam materials: Application of analytical and numerical tools for the optimization of forecasting models. Appl Acoust. 2020;107166. doi:10.1260/1351-010X.19.4.283
Bova W, Nijman E, Polanz M, Mundo D. Design of a slow sound based meta‑poro‑elastic material with enhanced absorption capabilities. J Sound Vib. 2025;613:119137. doi:10.1016/j.jsv.2024.118855
Song G, et al. Modeling and optimizing a broadband sound absorber consisting of a granular activated carbon stack backed by a poro‑elastic layer. Noise Control Eng J. 2024;72(5). doi:10.3397/1/377230
Jamalabadi MYA. A conservative numerical framework for modeling nonlinear ultrasound propagation in thermo‑viscous tissue phantom. Mathews J Surg. 2025;8(2):41. doi:10.30654/MJS.10041
Jamalabadi MYA. Frequency analysis and control of sloshing coupled by elastic walls and foundation with smoothed particle hydrodynamics method. J Sound Vib. 2020;476:115310. doi:10.1016/j.jsv.2020.115310
Khatami I, Jamalabadi MYA. Optimal design of microphone array in a planar circular configuration by genetic algorithm enhanced beamforming. J Therm Anal Calorim. 2020;145(4):1817‑25. doi:10.1007/s10973-020-09994-0
Jamalabadi MYA, Kwak MK. Dynamic modeling of a galloping structure equipped with piezoelectric wafers and energy harvesting. Noise Control Eng J. 2019;67(3):142‑54. doi:10.3397/1/376713
Jamalabadi MYA, Shadloo MS, Karimipour A. Maximum obtainable energy harvesting power from galloping‑based piezoelectrics. Math Probl Eng. 2020;2020:1‑8. doi:10.1155/2020/6140853
Jamalabadi MYA. Acoustic‑magnetic synergy for olfactory drug delivery to the brain. Mathews J Pharm Sci. Forthcoming 2026.
Jamalabadi MYA, Xi J. Olfactory drug aerosol delivery with acoustic radiation. Biomedicines. 2022;10(6):1347. doi:10.3390/biomedicines10061347
Bruschi V, Grossi L, Dourou NA, Quattrini A, Vancheri A, Leidi T, Cecchi S. A review on head‑related transfer function generation for spatial audio. Appl Sci. 2024;14(23):11242. doi:10.3390/app142311242
Li Z, Wang J, Huang Y, Zhang Z, Huang Q. A unified porous model integrating Biot theory for sound absorption design and optimization of perforated‑porous composite structures. Mater Today Commun. 2025;112965. doi:10.1016/j.mtcomm.2025.112965
Gazzola C, Corigliano A, Zega V. Total harmonic distortion estimation in piezoelectric micro‑electro‑mechanical‑system loudspeakers via a FEM‑assisted reduced‑order‑model. Mech Syst Signal Process. 2025;111762. doi:10.1016/j.ymssp.2024.111762
Shaw EAG, Teranishi R. Sound pressure generated in an external‑ear replica and real human ears by a nearby point source. J Acoust Soc Am. 1968;44(1):240‑9. doi:10.1121/1.1911052
Rosowski JJ. The effects of external‑ and middle‑ear filtering on auditory threshold and noise‑induced hearing loss. J Acoust Soc Am. 1991;90(1):124‑35. doi:10.1121/1.401306
Zwislocki J. Analysis of the middle‑ear function. Part I: Input impedance. J Acoust Soc Am. 1962;34(9B):1514‑23. doi:10.1121/1.1918382
Rosowski JJ. Outer and middle ears. In: Springer handbook of auditory research. New York: Springer; 1994. p.172‑247. doi:10.1007/978-1-4612-2700-7_6
Puria S, Allen JB. A parametric study of cochlear input impedance. J Acoust Soc Am. 1991;89(1):287‑309. doi:10.1121/1.400675
International Electrotechnical Commission. IEC 60318‑4: Electroacoustics – Simulators of human head and ear – Part 4: Occluded‑ear simulator for the measurement of earphones coupled to the ear by means of ear inserts. Geneva (CH): IEC; 2014.
Welti T, Devantier A. Headphone sound quality: The importance of proper measurement and equalization. Audio Eng Soc Conv Pap. 2014;9155.






 Scan and get link