IGMIN: We're glad you're here. Please click 'create a new query' if you are a new visitor to our website and need further information from us.
If you are already a member of our network and need to keep track of any developments regarding a question you have already submitted, click 'take me to my Query.'
Welcome to IgMin Research – an Open Access journal uniting Biology, Medicine, and Engineering. We’re dedicated to advancing global knowledge and fostering collaboration across scientific fields.
At IgMin Research, we bridge the frontiers of Biology, Medicine, and Engineering to foster interdisciplinary innovation. Our expanded scope now embraces a wide spectrum of scientific disciplines, empowering global researchers to explore, contribute, and collaborate through open access.
Welcome to IgMin, a leading platform dedicated to enhancing knowledge dissemination and professional growth across multiple fields of science, technology, and the humanities. We believe in the power of open access, collaboration, and innovation. Our goal is to provide individuals and organizations with the tools they need to succeed in the global knowledge economy.
IgMin Publications Inc., Suite 102, West Hartford, CT - 06110, USA
The objective of this research paper is to examine and assess the correlation between the economic expansion of European Union member states and the escalating rate of motorization, which subsequently leads to road accidents resulting in significant loss of life and injury. A statistical analysis of economic growth, the rate of motorization, and road incidents in EU member states from 2010 to 2020 constitutes the research methodology. The research paper employs a quantitative approach to analysis and comparison. The research paper demonstrates how an increase in the number of motor vehicles in EU member states contributes to road accidents and human mortality. Varying degrees of economic development are associated with disparities between the rate of motorization expansion and the decline in fatalities. Because the rate of increase in motor vehicle usage surpasses the decline in fatalities per motor vehicle at low-income levels. At increased levels of income, the opposite occurs. Practical Implications: This research paper illustrates the importance for road traffic safety authorities to be aware of safety performance indicators and to incorporate them into legislative deliberations in order to bolster the European Union’s “zero victims” objective and provide enhanced protection for motor vehicle accident victims. Originality – This paper examines the correlation between motorization rates and fatalities in various EU member states with varying degrees of economic development over the past few decades.
The European Union (EU) Member States acknowledged the significance of the progress made from 2011 to 2020 in enhancing road safety. They vowed to continue working towards the ultimate objective of Vision Zero for 2050, with attainable targets for the decade-long period from 2021 to 2030. The primary aim for 2030 is to achieve a 50% reduction in fatalities and serious injuries resulting from road accidents [11International road safety policies relevant to the 2021-2030 ten-year period Executive Summary. National Road Safety Observatory. 16 October 2020; 1.3.]. The primary determinants of road accidents are environmental factors and human error. Human factors include driving while distracted or intoxicated, racing, disregarding red lights and stop signs, and fatigue. Road conditions, climatic conditions, and vehicle defects are all environmental factors. Given that human error accounts for approximately 94% of all road accidents [22Chimenty E. Common Causes of Car Accidents.2024.], adherence to traffic regulations, driver education and awareness, and the implementation of vehicle safety measures are critical in mitigating the likelihood of such incidents.
Road safety in the European Union has substantially improved over the past two decades. The number of road fatalities has decreased by 61.5% between 2001 and 2021, from approximately 51,400 to 19,800. However, the level of progress in road safety has fallen short of fulfilling the European Union’s political goal of reducing fatalities on its roads by 75% between 2001 and 2020, as outlined in several strategic documents published by the Commission in the last two decades (e.g., the White Paper on European Transport Policy for 2002 and the Communication from the Commission Towards a Europea). Specifically, the EU aimed to achieve this reduction by 50% between 2001 and 2010, and an additional 50% between 2011 and 2020.
Country economic expansion is correlated with an increase in the rate of motorization. The scientific literature places great importance on motorization [33Sperling D, Clausen E. The Developing World’s Motorization Challenge. Journal “Issues in Science and Technology. 2002; XIX:1.] due to the fact that personal vehicles offer unparalleled freedom and access to products, services, and activities [44Brueckner M, Lederman D. Inequality and economic growth: the role of initial income Journal of Economic Growth. September 2018; 23:3; 341–366.]. Motorization provides businesses with a streamlined method to accelerate productivity. Conversely, personal mobility and motorization give rise to challenges, particularly in urban areas: fatalities and injuries, and air pollution [5517 Annual Road Safety Performance Index. 17th Annual Road Safety Performance Index (PIN Report). ETSC. 2023.].
This article provides a comprehensive analysis of the state of road traffic safety in EU member states. In order to achieve the aforementioned aim, the subsequent objectives are established: Determine a correlation between the level of motorization and economic growth in EU member states and the number of fatalities resulting from road traffic accidents. The approach to the article research will be predicated on an exhaustive examination of the transport sectors of EU member states.
The purpose of this study is to examine and assess the correlation between economic growth, motorization rates, and road traffic injuries from 2010 to 2020. The Statistical Package for the Social Sciences (SPSS) and Microsoft Excel were utilized to analyze the data.
The article’s research is novel in that it is connected to global objectives to reduce road traffic accidents and identify means to achieve “zero victims” and “zero carbon dioxide emissions” by 2050.
Theoretical concepts of economic growth, motorization, and traffic fatalities
Scientific investigations commonly employ the real GDP per capita ratio to assess the degree of economic development. The indicator is determined by dividing the real GDP of a given year by the average population of that year. The value of the entire final output of goods and services generated by an economy during a specified period is denoted by the GDP. In addition to serving as an indicator of economic activity, it also functions as a surrogate for the advancement of a nation’s material standard of living. As the economy of EU Member States expands, so does the degree of motorization among the populace; this, in turn, contributes to an escalating incidence of road accidents that result in fatalities and injuries [66Renelt D. Economic growth: a review of the theoretical and empirical literature (English). Policy, Research, and External Affairs working papers; No. WPS 678. Macroeconomic adjustment and growth Washington, D.C. World Bank Group. http://documents.worldbank.org/curated/en/317201468739133235/Economic-growth-a-review-of-the-theoretical-and-empirical-literature.]. Additionally, the expansion of motorization contributes to air pollution and, by extension, impacts climate change. The United Nations issued the following declaration in October 2018: “To avert the catastrophic effects of climate change, net anthropogenic global carbon emissions must be reduced by 45% compared to 2010 levels by 2030, and should reach zero by 2050” [77Guillen M. How Today’s Biggest Trends Will Collide and Reshape the Future of Everything; St. Martin’s Press: New York, NY, USA. 2020.]. As stated by the authors of [88Pachauri RK, Meyer LA. (Eds.). Core Writing Team: Climate Change 2014: Synthesis Report. Contribution of Working Groups I, II and III to the Fifth Assessment Report of the Intergovernmental Panel on Climate Change; IPCC: Geneva, Switzerland. 2014. https://www.ipcc.ch/site/assets/uploads/2018/02/SYR_AR5_FINAL_full.pdf (accessed on 2 July 2022).], despite the fact that the greenhouse effect is an inherent and vital natural phenomenon, there is substantial evidence to suggest that human activity has substantially accelerated this process. In comparison to the pre-industrial era, economic and population expansion has increased anthropogenic greenhouse gas (GHG) emissions [99Borisova EV, Pyataeva OA. Digitalization in the transport industry: A development perspective. In Proceedings of the IOP Conference Series: Materials Science and Engineering, Novosibirsk, Russia. 22–27 May 2020; IOP Publishing: Bristol, UK. 2020.-1414International Society of Transport Aircraft Trading. 2021. https://www.istat.org/], resulting in carbon dioxide, methane, and nitrous oxide concentrations in the atmosphere that are “unprecedented for at least the last 800,000 years” [88Pachauri RK, Meyer LA. (Eds.). Core Writing Team: Climate Change 2014: Synthesis Report. Contribution of Working Groups I, II and III to the Fifth Assessment Report of the Intergovernmental Panel on Climate Change; IPCC: Geneva, Switzerland. 2014. https://www.ipcc.ch/site/assets/uploads/2018/02/SYR_AR5_FINAL_full.pdf (accessed on 2 July 2022).]. Law and numerous other authors have examined the correlation between economic growth, motorization level, and the adverse consequences that ensue. David W. Jones, Teik Hua, Kopits and Cropper, Teik Brueckner, Daniel Lederman, Bener, et al. Using panel data from 1963 to 1999 for 88 countries, the scientists Kopits and Cropper analyzed the effect of income growth on the mortality rate due to traffic fatalities, fatalities per motor vehicle, and the motorization rate (vehicles per population). In particular, they estimated fixed effects models for fatalities per vehicle, fatalities per population, and fatalities per vehicle, and projected traffic fatalities and the stock of motor vehicles through 2020 using these models. There exists an initial positive correlation between per capita income and the motor vehicle fatality rate, followed by an apex and a subsequent decline. This is due to the fact that the rate of increase in motor vehicle usage surpasses the decline in fatalities per motor vehicle at low-income levels [1515European Commission European Road Safety Observatory. Road safety targets Monitoring report. Road Safety targets Monitoring (europa.eu). May 2021.]. At increased levels of income, the opposite occurs. In 1985, the highest per capita income level associated with traffic fatalities was approximately $8,600 (in international currencies). Predictions regarding forthcoming traffic fatalities indicate that there will be an approximate 66% increase in the worldwide road death toll from 2000 to 2020 [1616Kopits E, Cropper M. Traffic fatalities and economic growth. 2003.]. According to a number of studies, the relationship between road fatalities and economic expansion is U-shaped. They discover in their research [1010Law TH, Noland R, Evans A. The sources of the Kuznets relationship between road fatalities and economic growth. Journal of Transport Geography, Elsevier.2011; 19(2).] that this correlation holds true for nonfatal road injuries in developed nations as well, but not in developing nations. They write that while an urbanization trend, an increase in the number of motor vehicles, and an aging population were all expected to reduce road injuries in developed nations, the opposite was true in developing countries. Research conducted in developed nations has identified a negative U-shaped correlation between road traffic accidents and economic growth [1717van Beeck EF, Borsboom GJ, Mackenbach JP. Economic development and traffic accident mortality in the industrialized world, 1962-1990. Int J Epidemiol. 2000 Jun;29(3):503-9. doi: 10.1093/ije/29.3.503. PMID: 10869323.]. A number of studies have demonstrated that road fatalities and economic growth follow the Kuznets curve, an inverted U-shaped relationship: that is, road fatalities increase as income levels fall, but decline once they surpass a certain threshold [1010Law TH, Noland R, Evans A. The sources of the Kuznets relationship between road fatalities and economic growth. Journal of Transport Geography, Elsevier.2011; 19(2).]. An increasing number of studies have been devoted to the aforementioned issues in recent decades. In the future, policymakers must integrate long-term technological solutions with short-term behavioral modifications, according to Chapman [33Sperling D, Clausen E. The Developing World’s Motorization Challenge. Journal “Issues in Science and Technology. 2002; XIX:1.], in order to ensure sustainable transportation. A recent World Bank study, supported by Bloomberg Philanthropies, concludes that low and middle-income countries could realize substantial long-term income gains by reducing road traffic fatalities and injuries. The report “The High Toll of Traffic Injuries: Unacceptable and Preventable” analyzes the situations of China, India, the Philippines, Tanzania, and Thailand [1818Road Deaths and Injuries Hold Back Economic Growth in Developing Countries. World Bank press release. January, 2018. https://www.worldbank.org/transport.,1919World Bank Group. Report. The High Toll of Traffic Injuries: Unacceptable and Preventable. January 9, 2018.] and introduces a new global methodology for calculating the economic impact of road safety. The report indicates that although road traffic fatalities and injuries are widely acknowledged, the correlation between road traffic injuries and economic development remains poorly understood. An investment in human capital is equivalent to an investment in transportation safety, as quantified in the new report. Over a twenty-four-year period, countries that fail to invest in road safety may forfeit a potential 7% - 22% increase in per capita GDP growth, according to the study. This requires policymakers to prioritize road safety investments that have been demonstrated to be effective.
The targets of the EU “Zero victims” vision in 2050
The European Commission reaffirmed its demand that member states of the European Union increase their national-level implementation of initiatives and efforts. The forthcoming National Road Safety Plan also includes the 2030 objective of further reducing fatalities and severe injuries as its second objective. In addition to the goals established for the forthcoming decade, the groundwork has been prepared for additional and more ambitious aspirations. Notably, the Stockholm Declaration of February 2020 outlines a strategy to achieve a “zero victims” vision by the year 2050.
The European Union’s Parliament authorized motor insurance regulations in October 2021, enhancing the protection of victims of road accidents. The Council must still formally ratify the new regulations before granting EU member states the subsequent two years to put them into effect. MEPs adopted a resolution on the EU Road Safety Policy Framework on 5 October 2021, in which they outlined the primary measures required to achieve the objective of zero fatalities on European roads by 2050.
These include safe speed limits (30 km/h in residential areas), zero tolerance for driving under the influence of alcohol, and increased infrastructure and vehicle safety features. This is in response to the road safety policy proposal for 2021-2030 put forth by the European Commission. MEPs adopted new regulations on April 16, 2019, mandating the installation of thirty advanced safety features, including intelligent speed assistance, driver distraction warning, and emergency braking system [2020Roger G, Dipan B, Maria C, Georges D, John K, Raman K, Kazuyuki N, Yin Q. Motorization Management for Development: An Integrated Approach to Improving Vehicles for Sustainable Mobility. World Bank, Washington. DC. 2022. http://hdl.handle.net/10986/37589].
Compulsory safety technologies have the potential to avert a minimum of 140,000 severe injuries and preserve over 25,000 lives by 2038, considering that human error constitutes an estimated 95% of road traffic accidents. The EU has also strengthened regulations governing the administration of infrastructure safety and is working to establish standardized protocols for autonomous vehicles in an effort to improve road safety.
Despite the significant postponement of these proposals, there remains optimism that consensus can be achieved prior to the conclusion of the ongoing EU political mandate (2019-2024) in order to optimize the potential for saving lives during the 2021-2030 period of the EU Road Safety Policy Framework. It should be noted that road safety will not be enhanced by every component of the proposed bundle.
Country initiatives will be crucial for the successful implementation of the Safe System approach throughout Europe and for the European Union to meet its 2030 targets. Poland received its inaugural 2023 Road Safety Performance Index (PIN) Award from the European Transport Safety Council (ETSC). Between 2012 and 2022, the nation reduced road fatalities by 47%, a figure only surpassed by Lithuania, the previous year’s victor. The average reduction in the EU was 22%. Road mortality in Poland, defined as the number of road-related fatalities per inhabitant, decreased from 93 per million in 2012 to 50 per million in 2017. In 2022, mortality was lower than in Italy (54 per million). With 21 per million, Norway had the safest roadways in Europe, followed by Sweden with 22 per million. The European Commission released three legislative proposals pertaining to road safety on March 1, 2023:
a revision of the EU driving license directive;
an amendment to the cross-border enforcement (CBE) directive; and
a proposition for a novel EU directive concerning driving disqualifications.
Analysis of road fatalities in different EU countries and EU targets
Thousands of individuals are killed or severely injured annually in collisions on EU roads. Based on data from Driving Mobility for Europe [2121Driving Mobility for Europe. May, 2023.], Sweden and Malta have the lowest road fatality rates in relation to their respective populations, while Romania and Bulgaria have the highest rates. In 2021, the countries with the lowest road fatality rates relative to their respective populations were Malta (17), Sweden (18), and Denmark (23), followed by Ireland (27), the Netherlands (28), Germany (31), and Spain (32), with Luxembourg (38), Finland and Austria (both 40), Estonia (43) and Belgium (43), respectively.
Conversely, Bulgaria (81), Latvia (78), and Croatia (72) exhibited the greatest rates of road traffic fatalities per million inhabitants, while Romania exhibited the lowest rates (92). The average number of road traffic victims per million inhabitants in the European Union was 45 in 2021.
In the European Union, variations can be observed among member states. For example, Germany, Spain, and the Netherlands each had 5,387 fatalities in 2019, which accounts for 24% of the fatalities in the European Union for a population of 33% in 2017. This indicates that this trio of populous nations outperforms the entire European Union. In contrast, with 5401 fatalities in 2019, Poland, Bulgaria, and Romania account for 24% of EU fatalities but only 15% of the population in 2017. Although these six countries account for 48% of the European Union’s population and 48% of EU fatalities collectively, the second group of three countries has a 120% greater fatality rate per population than the first group. In 2017, France and Italy collectively accounted for 6,417 fatalities, or 28% of all fatalities in the European Union for a population of 29%. As a result, the fatality rate per capita in this third group is 33% greater than in the better group countries. These eight nations account for 76% of EU fatalities and 77% of the EU’s population, respectively.
In 2018, 12% of fatalities on EU roads involved individuals between the ages of 18 and 24, whereas this age group comprises only 8% of the European population. Young individuals are consequently disproportionately more prone to being engaged in a fatal motor vehicle collision [2222European Commission. Towards a European road safety area: policy orientations on road safety 2011-2020. 2010. https://ec.europa.eu/transport/sites/transport/files/road_safety/pdf/com_20072010_en.pdf]. Since 2010, however, fatalities among this age cohort have decreased by 43%. The percentage of fatalities among those aged 65 and older increased from 22% in 2010 to 28% in 2018. Children aged 15 or younger comprised 2% of the total.
Males comprised 76% of road fatalities across the EU, a proportion that has remained largely constant since 2010 and is consistent across all EU member states [2323European Parliament News. Road fatality statistics in the EU (infographic). 2019.]. According to an examination of safety performance indicators, speed emerges as the primary contributor to traffic accidents in Europe, with driving under the influence, distraction, road conditions, and driving under the influence following suit.
The European Union’s objective of achieving a 50% reduction in road fatalities from 2010 to 2020 was not accomplished. Despite the fact that the extraordinary conditions of 2020 have caused a significant decline in road fatalities in a number of nations, this effect is probably transitory. The underlying trajectory, however, continues to be downward. In 2019, the following eight Member States recorded their lowest fatality rates ever: Croatia, Finland, Sweden, France, Germany, Greece, Latvia, and Luxembourg. Preliminary data for 2020 indicates that Greece has achieved the European Union target, while eight additional countries have achieved a minimum 40% reduction in their numbers. In 2020, there were 42 fatalities per million inhabitants of the European Union. This was significantly less than the 51 fatalities per million inhabitants in 2019. In 2020, the countries with the highest fatality rates were Bulgaria (67 deaths per million inhabitants), Latvia (74 deaths per million inhabitants), and Romania (85 deaths per million inhabitants). Sweden had the safest roads, with 18 deaths per million inhabitants, and Malta had 21 deaths per million inhabitants. The decline in annual fatalities at the European Union level was significant (-17%), primarily attributable to decreased traffic volumes. Bulgaria, Italy, and Hungary all documented strong performance in the previous year, 2020.
Comparing the levels of economic growth, motorization, and fatalities in the EU
Luxembourg and Ireland exhibited the highest levels of GDP per capita in the European Union in 2022, surpassing the EU average by 161% and 133%, respectively. At 41% below the EU average, Bulgaria had the lowest GDP per capita of all EU Member States. With GDP per capita exceeding the EU average by 133%, Ireland ranks second among EU Member States. Denmark, the Netherlands, Austria, Sweden, and Belgium all rank higher, with each having a GDP per capita that is over 20% above the average. In addition to France, Germany, Finland, and Malta are other EU Member States that have a GDP per capita that surpasses the EU average. Per capita GDP in Italy, Slovenia, Cyprus, and the Czech Republic is less than 10% lower than the EU average. The GDP per capita of Lithuania, Estonia, Spain, and Poland is 10% - 20% lower than the EU average. Hungary, Portugal, Romania, Latvia, and Croatia all have GNPs that are below the average by less than 30%. According to [2424Eurostat (Statistics Explained). GDP per capita. 2022. https://ec.europa.eu/eurostat/statistics-explained/index.php?title=GDP_per_capita.], the GDP per capita of Slovakia and Greece is below the average by less than 40%.
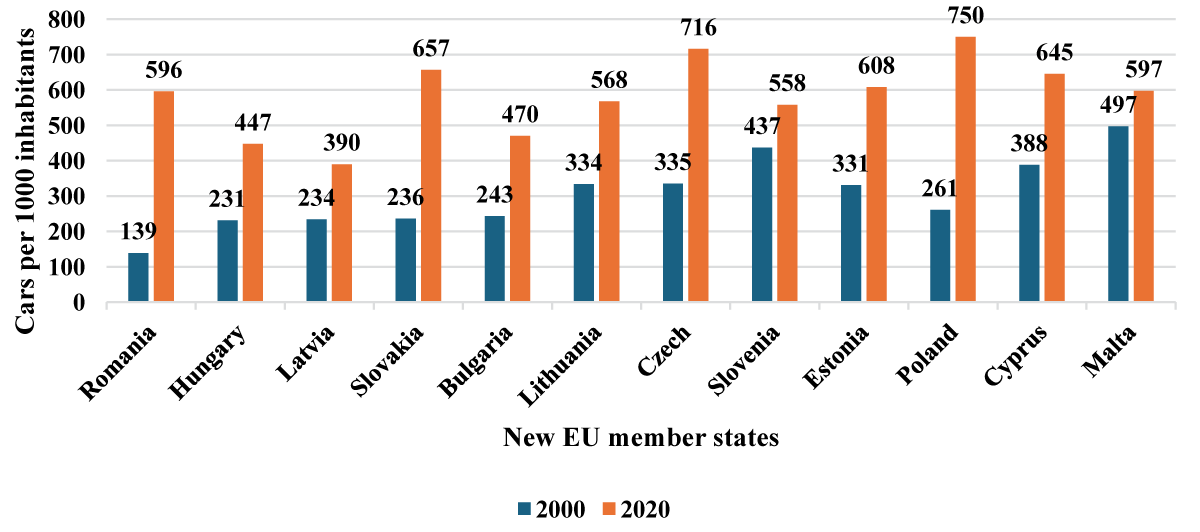
According to Figure 1, the passenger car motorization rate per 1000 inhabitants of the following new EU member states increased significantly from 2000 to 2020: Poland (750), Slovakia (657), and the Czech Republic (716). Lithuania (568), Malta (597), Estonia (608), and Romania (596) all exhibited average growth rates. Bulgaria experienced modest growth at 470, Latvia at 390, and Hungary at 447.
Figure 1: Motorization rate of new EU Member States in the 2000-2020 period (passenger cars per 1000 inhabitants) (source: Eurostat).
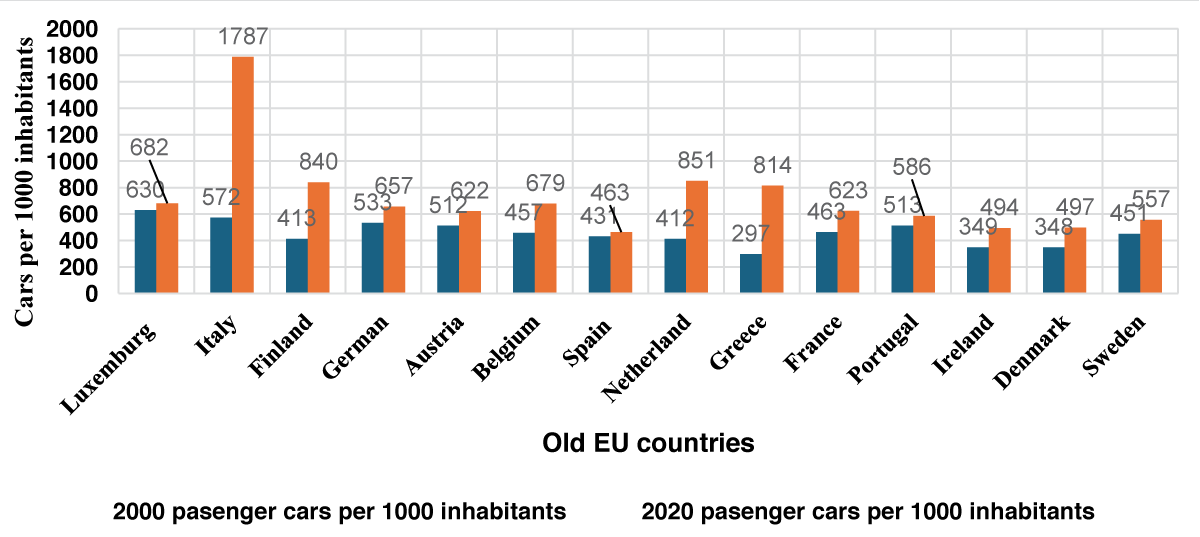
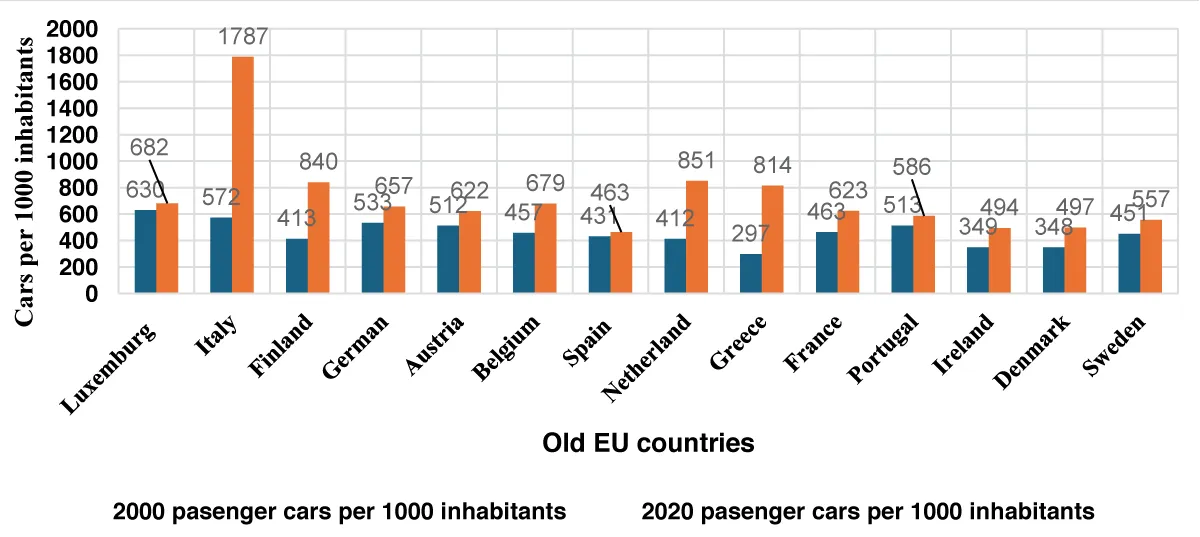
Figure 2 illustrates that between 2000 and 2020, the countries with the highest motorization rate (passenger vehicles per 1000 inhabitants) were Italy (1787), Greece (814), the Netherlands (851), and Finland (840). France experienced an average growth rate of 623, Belgium 679, and Sweden 557. Low growth was observed in Spain (463), Denmark (497), and Ireland (494).
Figure 2: Motorization rate of old EU Member States in the 2000 – 2020 period (Source: Eurostat).
The year 2020 will be characterized by the following trends: The average fatality rate per million inhabitants was approximately 45, and the average level of motorization was 560 automobiles per 1000 inhabitants. Luxembourg, boasting the greatest real GDP per capita (80.3 trillion euros), also had the highest motorization rate (682 cars per 1000 inhabitants). The number of fatalities per one million inhabitants in this nation decreased from 159 in 2000 to 42 in the present year. In contrast, Bulgaria had a real GDP per capita of 6.3 euros, a motorization rate of 470 vehicles per 1000 inhabitants, and 98 fatalities per 1 million inhabitants.
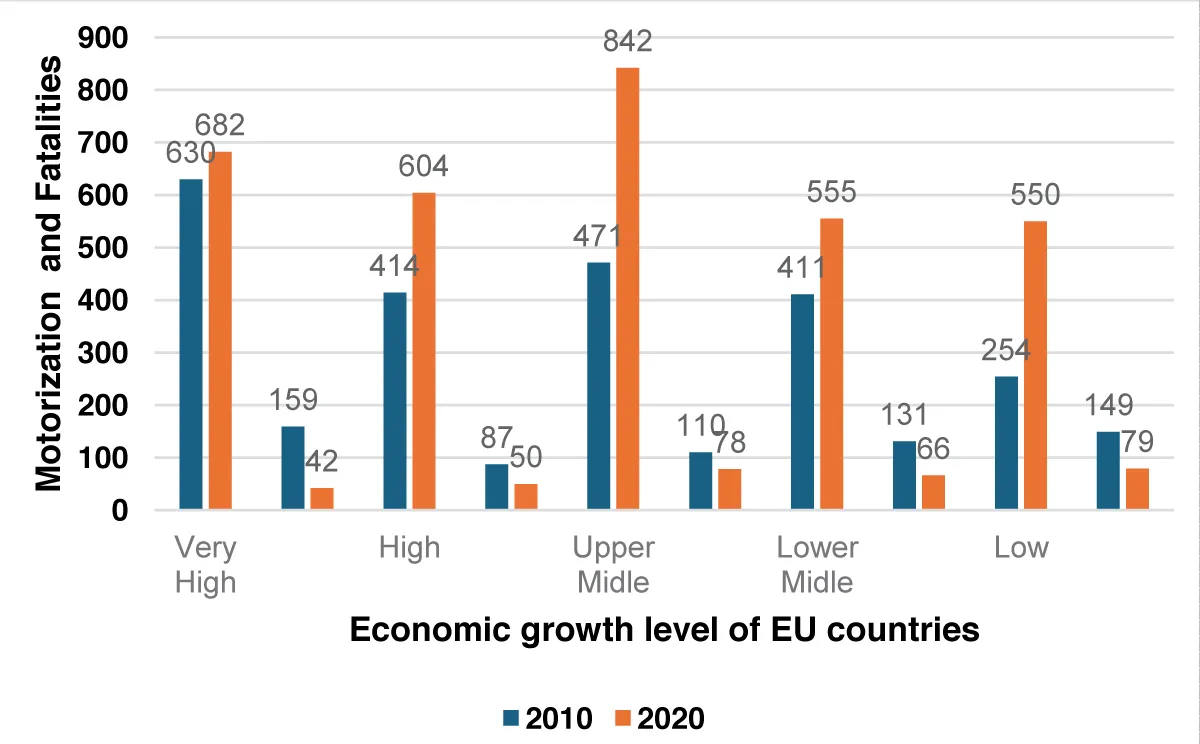
The EU countries are classified into five economic levels in Figure 3: very high economic level, high economic level, upper middle economic level, lower middle economic level, and low economic level. Subsequently, an analysis was conducted to determine the relationship between the increase in the motorization rate and the reduction in fatalities within each of these groups. The relationship between the growth rate of motorization and the decline in fatalities in countries with varying levels of economic development is illustrated in Figure 3. From 2000 to 2020, the level of motorization in Luxembourg, a country with a very high standard of living, increased by 8.3%, while the number of fatalities decreased by 66%. The motorization rate increased by 46% in the high-income EU countries (Netherlands, Sweden, Ireland, Denmark, and Austria), while the number of fatalities decreased by 57%. The motorization rate increased by 79% in countries with an upper-middle economic level (Spain, Italy, France, Germany, Belgium, and Finland), whereas fatalities decreased by 71%.
Figure 3: Relationship between motorization (passenger cars per 1000 inhabitants) and fatalities in EU countries of different economic growth levels (fatalities per 1 million inhabitants) (Source: Eurostat).
Lower middle economic level nations (Czegali, Malta, Cyprus, Slovenia, Portugal, and Greece) experienced a 35% increase in the number of vehicles on the road, while fatalities decreased by 50%. The level of motorization increased by 117% in low-income countries (Bulgaria, Romania, Latvia, Lithuania, Poland, Slovakia, Croatia, Estonia, and Hungary), while the number of fatalities decreased by 53%.
These results confirm the hypothesis that the rate of increase in motor vehicles is lower than the decline in fatalities per motor vehicle in EU countries with higher income levels, whereas the rate of increase in motor vehicles is higher than the decline in fatalities per motor vehicle in countries with lower income levels. The primary discoveries will be transformed into goals, which subsequently inspire actions concerning the implementation of the “Zero Victims” vision.
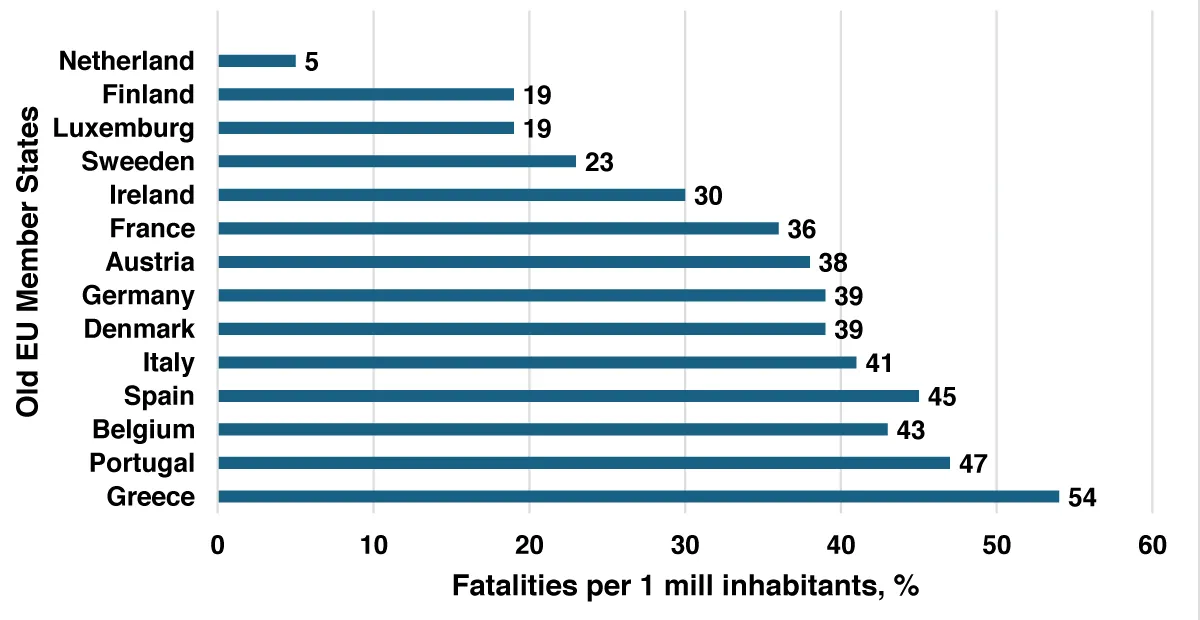
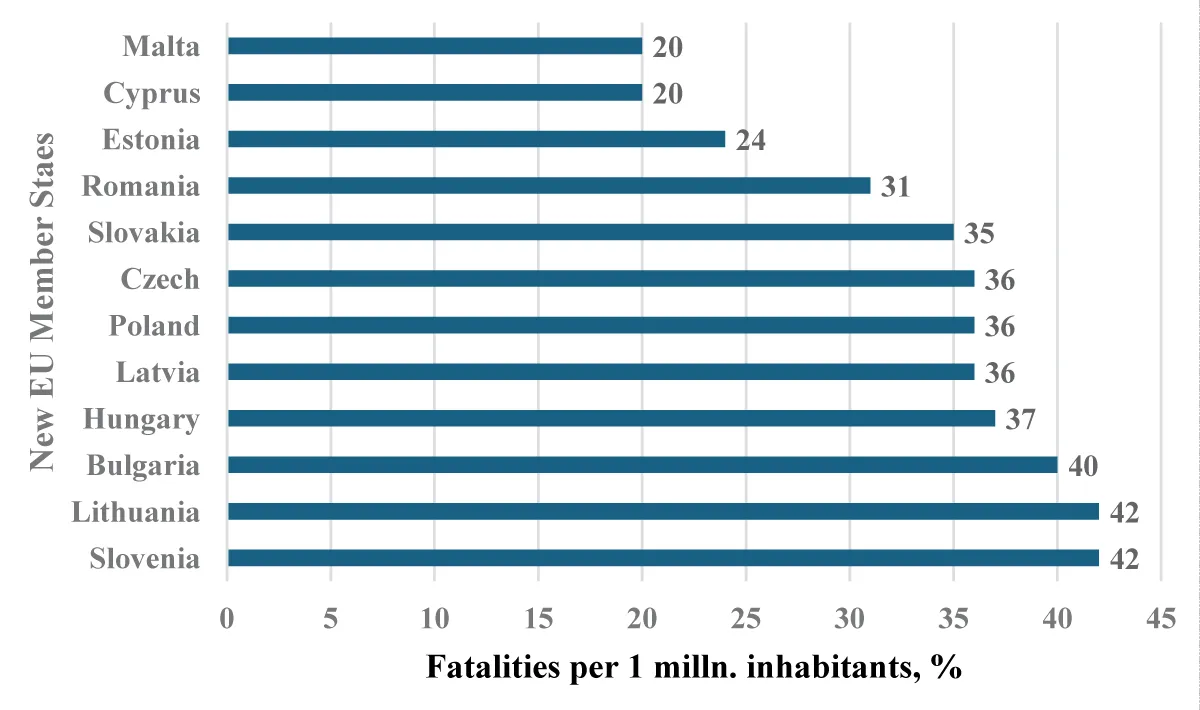
Comparing the data in Figures 4 and 5, the average number of road fatalities in the European Union decreased by 36% between 2010 and 2020, with Greece, Croatia, Spain, Portugal, and Slovenia experiencing the greatest decreases (42% or more). Two of these higher-performing nations have accomplished the 50% reduction goal by 2020.
Figure 4: Decrease of road mortality rate in old EU countries during 2010-2020 year (fatalities per 1 mill inhabitants) percentage change. Source: European Commission: European Road Safety Observatory.
Figure 5: Decrease of road mortality rate in new EU countries during the 2010-2020 year (fatalities per 1 million inhabitants) percentage change. Source: European Commission: European Road Safety Observatory.
In retrospect, the European Union made commendable strides in the reduction of road fatalities during the years 2012 and 2013, as evidenced by the 8% decline in such fatalities. The initial surge, however, was succeeded by six years of stagnation during the period 2014-2019, during which there was only a 6% decline.
In contrast to 2019, there was an extraordinary decline of 17% in 2020. However, this result was significantly influenced by the Covid-19 pandemic-related travel restrictions throughout Europe [2525Injuries in the European Union: summary of injury statistics for the years 2008-2010. 2013. http://ec.europa.eu/health/data_collection/docs/idb_report_2013_en.pdf]. Additionally, there was a consistent decline of 13% in 2021 compared to 2019, although there was a 5% increase in road fatalities compared to 2020. This increase can be attributed to the progressive relaxation of travel restrictions and lockdown requirements throughout Europe. Significantly more lives could have been preserved if the annual reduction of 6.7% required to achieve the EU’s 50% reduction target within a decade had been accomplished.
Hypothesis 1: Economic growth is positively correlated with the rate of motorization.
Hypothesis 2: The growth rate of motorization is positively correlated with the number of road fatalities.
Information sources
Data was gathered over a decade-long period, spanning from 2010 to 2020. http://www.etsc.eu/15th-annual-road-safety-performance-index-pin-report is the data source.
Austria, Belgium, Bulgaria, Cyprus, the Czech Republic, Germany, Denmark, Estonia, Spain, Finland, France, Greece, Croatia, Hungary, Ireland, Italy, Luxembourg, Latvia, Lithuania, Malta, the Netherlands, Poland, Portugal, Romania, Sweden, Slovenia, and Slovakia were among the 27 EU member states whose data were analyzed in our study.
Criteria for information selection: We formulated the subsequent variables
Economic growth is measured by GDP per capita (in Euros per inhabitant), proxies for road accidents are calculated using road mortality rate (deaths in road accidents per million inhabitants), and motorization rate is calculated using passenger cars per 1000 inhabitants.
Simple linear regression was employed to ascertain the correlation between two quantitative variables. The relationship between variables is represented by regression models, which apply a line to the observed data [2626Edwards AL, Freeman WH. Multiple Regression and the Analysis of Variance and Covariance. San Francisco. CA. 1979.]. Logistic and nonlinear regression models employ a curved line, as opposed to the straight line utilized by linear regression models. By employing regression analysis, one can approximate the relationship between changes in the independent variables and the changes in the dependent variable.
Vehicle collisions equal a0 plus a1 motorization rate plus +E; (Model 2) (2).
Analysis of the data and discourse on the findings
The data analysis was conducted using SPSS 16.0 software. The steps derived from the results are detailed in Table 1. T-values are positive (T > 0), indicating a positive correlation between economic growth and motorization rate; however, the calculated significance is only acceptable for the years 2011, 2012, and 2013 (as the corresponding levels of significance are 0.0006, 0.0007, and 0.0008, respectively). The initial hypothesis is therefore adopted.
Table 1: Results.
Adj R² - the coefficient of determination after adjustment;
The calculated difference, denoted in units of standard error, is denoted by T.
Indicate the level of certainty regarding the potential influence of the given coefficient on the dependent variable.
The expected sign indicates the statistical significance of the relationships.
The relationship is positive at this point.
The results of Model 1 validate the hypothesis that there is a positive correlation between economic growth and the rate of motorization throughout the entire period (T > 0). However, the significance of this relationship can only be established for the years 2011, 2012, and 2013 (levels of significance of 0.006; 0.007; 0.008). The acceptance of the first hypothesis is possible in light of this model.
The relationship between mortality rate and passenger vehicles per capita is represented by Model 2. Our results validate the hypothesis that the relationship is positive throughout the entire period (T > 0). However, we are only able to establish the significance of this relationship for the following years: 2011, 2012, 2013, 2014, and 2015 (levels of significance: 0.089; 0.082; 0.073; 0.092; 0.094). This model thus fails to provide empirical support for the second hypothesis, which, in light of these findings, should be rejected. This demonstrates that road incidents are influenced by additional variables, including environmental and human factors. Such is the constraint of the present study. Subsequently, it would be beneficial to formulate an additional hypothesis concerning the correlation between safety performance indicators and fatalities.
A case study on the relationship between road safety and economic development was presented in India in 2021 [2727Sinha A. Linkage Between Road Safety and Economic Development: A Case Study of India. Metamorphosis. Indian Institute of Management. 2021; 20(1) 7–15.]. Across Indian states and union territories, this study investigates the correlation between fatality risk (number of fatalities per 10,000 people), motorization level (number of vehicles per 10,000 people), fatality rate (number of fatalities per 10,000 vehicles), and real per capita GDP. Two distinct types of relationships were investigated: linear and log-linear. Additionally, the research endeavors to ascertain the real per capita GDP beyond which a decline in fatality risk is observed with each subsequent increase in per capita GDP.
Sweden exemplifies a country with a low danger of traffic accidents, with 2.8 fatalities per 100,000 inhabitants. Sweden is also recognized for its exceptionally secure transportation system. Zones designated for pedestrians provide protection from vehicles. Barriers separate cyclist-only zones from the main roads. An urban speed limit has been implemented with the intention of mitigating speeding and irresponsible behavior. Nationwide, enforcement of the stringent laws prohibiting inebriated driving is substantial. Zebra crossings and speed bumps with aggressive illumination provide additional protection for pedestrians against speed-related collisions.
The objective of the research paper was to identify the principal determinants that impact road traffic accidents, in light of the European Parliament’s adoption of a resolution on the EU Road Safety Policy Framework, which delineated the essential measures required to achieve the objective of zero fatalities on European roadways by 2050. The article presents a literature review and analysis of the correlation between the economic growth of European Union countries and the increasing rate of motorization, which in turn leads to road accidents that result in significant loss of life and injury. The rate of increase in motor vehicle usage surpasses the decline in fatalities per motor vehicle at low-income levels. At increased levels of income, the opposite occurs.
A statistical analysis of economic growth, the rate of motorization, and road accidents in EU member states from 2010 to 2020 was employed as part of the research methodology. Quantitative analysis and comparison methods are utilized in the research paper; to estimate the average annual variations in the rates, linear regression analysis was also performed. Research paper findings illustrate the correlation between economic growth in European Union member states and the proliferation of motor vehicles, which subsequently contributes to road accidents and human mortality: countries with lower income levels experience a faster rate of motor vehicle expansion than the reduction in fatalities per motor vehicle, while countries with higher income levels observe the opposite trend.
Practical implications
The research paper illustrates the necessity for road traffic safety authorities to be informed about safety performance indicators and incorporate them into the legislative process in order to reinforce the European Union’s “zero victims” objective and enhance the protection afforded to victims involved in motor vehicle incidents.
Initially, we distinguished the EU member states with the greatest and lowest rates of motorization growth per 1000 inhabitants by comparing the growth of passenger cars per 1000 inhabitants in old and new EU countries. The interaction between traffic accident fatality rates was assessed through the application of quantitative research methodology and a predetermined hypothesis. In conclusion, the hypothesis was confirmed. Our research proposal aimed to examine the correlation between motorization rate, economic development, and road accidents. The results of our empirical investigation indicate that these variables are positively correlated (refer to Table 1 for Model 1 outcomes). However, Model 2 was unable to validate the results with regard to the motorization factor; this is, without a doubt, one of the articles’ limitations. We acknowledge the constraints of our research and, as a result, plan to expand our investigation in order to establish a correlation between safety performance indicators and road incidents and to propose an additional hypothesis concerning the possibility of a link between the two.
The escalating prevalence of motorization as a result of economic expansion provides insight into the potential for road incidents if no steps are taken to reduce road fatalities. To achieve the “Zero Victims” objective, more advanced vehicle technologies, road infrastructure improvements, and driver education regarding better driving practices are required. Low traffic fatality rates are predominantly associated with nations that strictly enforce traffic regulations, implement safer vehicle designs, designate distinct lanes for pedestrians and cyclists, and enforce low-speed limits, particularly in urban regions.
International road safety policies relevant to the 2021-2030 ten-year period Executive Summary. National Road Safety Observatory. 16 October 2020; 1.3.
Chimenty E. Common Causes of Car Accidents.2024.
Sperling D, Clausen E. The Developing World’s Motorization Challenge. Journal “Issues in Science and Technology. 2002; XIX:1.
Brueckner M, Lederman D. Inequality and economic growth: the role of initial income Journal of Economic Growth. September 2018; 23:3; 341–366.
Renelt D. Economic growth: a review of the theoretical and empirical literature (English). Policy, Research, and External Affairs working papers; No. WPS 678. Macroeconomic adjustment and growth Washington, D.C. World Bank Group. http://documents.worldbank.org/curated/en/317201468739133235/Economic-growth-a-review-of-the-theoretical-and-empirical-literature.
Guillen M. How Today’s Biggest Trends Will Collide and Reshape the Future of Everything; St. Martin’s Press: New York, NY, USA. 2020.
Pachauri RK, Meyer LA. (Eds.). Core Writing Team: Climate Change 2014: Synthesis Report. Contribution of Working Groups I, II and III to the Fifth Assessment Report of the Intergovernmental Panel on Climate Change; IPCC: Geneva, Switzerland. 2014. https://www.ipcc.ch/site/assets/uploads/2018/02/SYR_AR5_FINAL_full.pdf (accessed on 2 July 2022).
Borisova EV, Pyataeva OA. Digitalization in the transport industry: A development perspective. In Proceedings of the IOP Conference Series: Materials Science and Engineering, Novosibirsk, Russia. 22–27 May 2020; IOP Publishing: Bristol, UK. 2020.
Law TH, Noland R, Evans A. The sources of the Kuznets relationship between road fatalities and economic growth. Journal of Transport Geography, Elsevier.2011; 19(2).
European Environment Agency. Sustainable and Smart Mobility Strategy. 789 Final ANNEX to the Communication from the Commission to the European Parliament, the Council, the European Economic and Social Committee and the Committee of the Regions Sustainable and Smart Mobi. COM. 2020. https://www.eea.europa.eu/policy-documents/com-2020-789-final
Motorization Rate of the New EU Member States in 2000–2019. 2021. www.eurostat.com
European Automobile Manufacturers Association (ACEA). 2019. https://www.acea.auto/
International Society of Transport Aircraft Trading. 2021. https://www.istat.org/
European Commission European Road Safety Observatory. Road safety targets Monitoring report. Road Safety targets Monitoring (europa.eu). May 2021.
Kopits E, Cropper M. Traffic fatalities and economic growth. 2003.
van Beeck EF, Borsboom GJ, Mackenbach JP. Economic development and traffic accident mortality in the industrialized world, 1962-1990. Int J Epidemiol. 2000 Jun;29(3):503-9. doi: 10.1093/ije/29.3.503. PMID: 10869323.
Road Deaths and Injuries Hold Back Economic Growth in Developing Countries. World Bank press release. January, 2018. https://www.worldbank.org/transport.
World Bank Group. Report. The High Toll of Traffic Injuries: Unacceptable and Preventable. January 9, 2018.
Roger G, Dipan B, Maria C, Georges D, John K, Raman K, Kazuyuki N, Yin Q. Motorization Management for Development: An Integrated Approach to Improving Vehicles for Sustainable Mobility. World Bank, Washington. DC. 2022. http://hdl.handle.net/10986/37589
Driving Mobility for Europe. May, 2023.
European Commission. Towards a European road safety area: policy orientations on road safety 2011-2020. 2010. https://ec.europa.eu/transport/sites/transport/files/road_safety/pdf/com_20072010_en.pdf
European Parliament News. Road fatality statistics in the EU (infographic). 2019.
Eurostat (Statistics Explained). GDP per capita. 2022. https://ec.europa.eu/eurostat/statistics-explained/index.php?title=GDP_per_capita.
Injuries in the European Union: summary of injury statistics for the years 2008-2010. 2013. http://ec.europa.eu/health/data_collection/docs/idb_report_2013_en.pdf
Edwards AL, Freeman WH. Multiple Regression and the Analysis of Variance and Covariance. San Francisco. CA. 1979.
Sinha A. Linkage Between Road Safety and Economic Development: A Case Study of India. Metamorphosis. Indian Institute of Management. 2021; 20(1) 7–15.
Peleckienė V. Analysis of EU Countries’ Capabilities to Achieve Ambitious “Zero Victim” Vision in 2050. IgMin Res. 23 Feb, 2024; 2(2): 131-138. IgMin ID: igmin155; DOI: 10.61927/igmin155; Available at: www.igminresearch.com/articles/pdf/igmin155.pdf
1Vilnius Gediminas Technical University, Management Cathedral Kęstutis, Lithuania
2Mykolas Riomeris University, Institute of Business and Economics, Lithuania
Address Correspondence: Valentina Peleckienė, Vilnius Gediminas Technical University, Management Cathedral Kęstutis, Lithuania, Email: [email protected]
How to cite this article: Peleckienė V. Analysis of EU Countries’ Capabilities to Achieve Ambitious “Zero Victim” Vision in 2050. IgMin Res. 23 Feb, 2024; 2(2): 131-138. IgMin ID: igmin155; DOI: 10.61927/igmin155; Available at: www.igminresearch.com/articles/pdf/igmin155.pdf
Figure 1: Motorization rate of new EU Member States in the 2...
Figure 2: Motorization rate of old EU Member States in the 2...
Figure 3: Relationship between motorization (passenger cars ...
Figure 4: Decrease of road mortality rate in old EU countrie...
Figure 5: Decrease of road mortality rate in new EU countrie...
Figure 1: Motorization rate of new EU Member States in the 2...
Table 1: Results....
International road safety policies relevant to the 2021-2030 ten-year period Executive Summary. National Road Safety Observatory. 16 October 2020; 1.3.
Chimenty E. Common Causes of Car Accidents.2024.
Sperling D, Clausen E. The Developing World’s Motorization Challenge. Journal “Issues in Science and Technology. 2002; XIX:1.
Brueckner M, Lederman D. Inequality and economic growth: the role of initial income Journal of Economic Growth. September 2018; 23:3; 341–366.
Renelt D. Economic growth: a review of the theoretical and empirical literature (English). Policy, Research, and External Affairs working papers; No. WPS 678. Macroeconomic adjustment and growth Washington, D.C. World Bank Group. http://documents.worldbank.org/curated/en/317201468739133235/Economic-growth-a-review-of-the-theoretical-and-empirical-literature.
Guillen M. How Today’s Biggest Trends Will Collide and Reshape the Future of Everything; St. Martin’s Press: New York, NY, USA. 2020.
Pachauri RK, Meyer LA. (Eds.). Core Writing Team: Climate Change 2014: Synthesis Report. Contribution of Working Groups I, II and III to the Fifth Assessment Report of the Intergovernmental Panel on Climate Change; IPCC: Geneva, Switzerland. 2014. https://www.ipcc.ch/site/assets/uploads/2018/02/SYR_AR5_FINAL_full.pdf (accessed on 2 July 2022).
Borisova EV, Pyataeva OA. Digitalization in the transport industry: A development perspective. In Proceedings of the IOP Conference Series: Materials Science and Engineering, Novosibirsk, Russia. 22–27 May 2020; IOP Publishing: Bristol, UK. 2020.
Law TH, Noland R, Evans A. The sources of the Kuznets relationship between road fatalities and economic growth. Journal of Transport Geography, Elsevier.2011; 19(2).
European Environment Agency. Sustainable and Smart Mobility Strategy. 789 Final ANNEX to the Communication from the Commission to the European Parliament, the Council, the European Economic and Social Committee and the Committee of the Regions Sustainable and Smart Mobi. COM. 2020. https://www.eea.europa.eu/policy-documents/com-2020-789-final
Motorization Rate of the New EU Member States in 2000–2019. 2021. www.eurostat.com
European Automobile Manufacturers Association (ACEA). 2019. https://www.acea.auto/
International Society of Transport Aircraft Trading. 2021. https://www.istat.org/
European Commission European Road Safety Observatory. Road safety targets Monitoring report. Road Safety targets Monitoring (europa.eu). May 2021.
Kopits E, Cropper M. Traffic fatalities and economic growth. 2003.
van Beeck EF, Borsboom GJ, Mackenbach JP. Economic development and traffic accident mortality in the industrialized world, 1962-1990. Int J Epidemiol. 2000 Jun;29(3):503-9. doi: 10.1093/ije/29.3.503. PMID: 10869323.
Road Deaths and Injuries Hold Back Economic Growth in Developing Countries. World Bank press release. January, 2018. https://www.worldbank.org/transport.
World Bank Group. Report. The High Toll of Traffic Injuries: Unacceptable and Preventable. January 9, 2018.
Roger G, Dipan B, Maria C, Georges D, John K, Raman K, Kazuyuki N, Yin Q. Motorization Management for Development: An Integrated Approach to Improving Vehicles for Sustainable Mobility. World Bank, Washington. DC. 2022. http://hdl.handle.net/10986/37589
Driving Mobility for Europe. May, 2023.
European Commission. Towards a European road safety area: policy orientations on road safety 2011-2020. 2010. https://ec.europa.eu/transport/sites/transport/files/road_safety/pdf/com_20072010_en.pdf
European Parliament News. Road fatality statistics in the EU (infographic). 2019.
Eurostat (Statistics Explained). GDP per capita. 2022. https://ec.europa.eu/eurostat/statistics-explained/index.php?title=GDP_per_capita.
Injuries in the European Union: summary of injury statistics for the years 2008-2010. 2013. http://ec.europa.eu/health/data_collection/docs/idb_report_2013_en.pdf
Edwards AL, Freeman WH. Multiple Regression and the Analysis of Variance and Covariance. San Francisco. CA. 1979.
Sinha A. Linkage Between Road Safety and Economic Development: A Case Study of India. Metamorphosis. Indian Institute of Management. 2021; 20(1) 7–15.


 Scan and get link