IGMIN: We're glad you're here. Please click 'create a new query' if you are a new visitor to our website and need further information from us.
If you are already a member of our network and need to keep track of any developments regarding a question you have already submitted, click 'take me to my Query.'
Welcome to IgMin Research – an Open Access journal uniting Biology, Medicine, and Engineering. We’re dedicated to advancing global knowledge and fostering collaboration across scientific fields.
At IgMin Research, we bridge the frontiers of Biology, Medicine, and Engineering to foster interdisciplinary innovation. Our expanded scope now embraces a wide spectrum of scientific disciplines, empowering global researchers to explore, contribute, and collaborate through open access.
Welcome to IgMin, a leading platform dedicated to enhancing knowledge dissemination and professional growth across multiple fields of science, technology, and the humanities. We believe in the power of open access, collaboration, and innovation. Our goal is to provide individuals and organizations with the tools they need to succeed in the global knowledge economy.
IgMin Publications Inc., Suite 102, West Hartford, CT - 06110, USA
This research used a bibliometric method and a Geographic Information System to estimate scientific productivity as well as simulate research outputs in countries around the world. From 2717 articles published on Scopus of Internet of Things in the environmental monitoring field during 2011-2025, results indicate that total research productivity is an increasing trend, and it increases sharply from 2022 and 2024. Y. Wang author, has the most research output as the first author (10 articles) and total research productivity (33 articles). Y. Zhang has the most cooperation articles (26 articles). A. Morchid author has the most publications in 2024, with 5 articles, while publication of 4 articles has Y. Wang, G. Marques, and J. Li authors, and it is distributed in 2024, 2020, and 2023. Almost all scientific output is published in China, and Y. Wang first author, has the most research output with 9 articles in China and 1 article in the United Kingdom. A. Shama, author, has not published in China, but it is published in two countries as India with 3 articles and Australia with 1 article. Publication of affiliations sharp increase in 2022-2025, and the Department of Computer Science and Engineering affiliation has the most research output with 82 articles in 2011-2025. Most research output of affiliations is distributed mainly in China, then is India. In the distribution of countries, China has the highest total research productivity, with first ranking in independent articles, collaborative articles, and total productivity in Internet of Things articles on SCOPUS.
Environmental monitoring is a necessary component of environmental science and policy design [11Lovett GM, Burns DA, Driscoll CT, Jenkins JC, Mitchells MJ, Rustad L, Shanley JB, Likens GE, Haeuber R. Who needs environmental monitoring? Front Ecol Environ. 2007;5(5):253-260.], and it plays a critical role in understanding impacts, offering data-driven insights that guide sustainable development, resource conservation [22Mulder KF. Innovation for sustainable development: from environmental design to transition management. Sustain Sci. 2007;2(2):253-263.,33Bringezu S, Bleischwitz R. Sustainable resource management: global trends, visions and policies. Routledge; 2017.]. It is an observation of pollutants and harmful factors to the environment to understand the state of the environment [44Artiola JF, Pepper IL, Brusseau M. Environmental monitoring and characterization. Burlington, MA: Elsevier Academic Press; 2004.,55Wiersma GB. Environmental monitoring. Boca Raton, FL: CRC Press; 2004.] or prevent health hazards as well as disasters. Traditionally, environmental monitoring relied on manual sampling and laboratory analysis, but with real-time, automated systems are now feasible due to innovations like Internet of Things (IoT) sensors, satellite-based remote sensing, in which IoT has revolutionized environmental monitoring through its ability to deploy interconnected sensors [66Rajesh GM, Gomadhi G, Malathi J, Namdeoo Nehul A, Krishnaveni. Innovative pathways in environmental monitoring and advanced technologies for sustainable resource management. J Environ Rep. 2019;17-20.] and it based sensors to be installed need to be connected, maintained and managed to extract the relevant information from air quality, water parameters, and soil health in real-time [77Environmental monitoring: A guide to ensuring a successful mobile IoT deployment. 2018.]. In other words, the Internet of Things (IoT) is the communications network of everyday objects containing sensors, actuators, and connectivity to external devices [88Laha SR, Pattanayak BK, Pattnaik S. Advancement of environmental monitoring system using IoT and sensor: A comprehensive analysis. AIMS Environ Sci. 2022;9(6):771-800.]. The “Internet of Things” (IoT) was first used in 1999 by British technology pioneer Kevin Ashton to describe a system in which objects in the physical world could be connected to the Internet by sensors [99Ashton K. That “internet of things” thing. RFID J. 2009;22(7):97-114.]. Internet of Things (IoT) refers to a concept in which machines and other physical objects are connected to the Internet [1010Ramlowat DD, Pattanayak BK. Exploring the Internet of things (IoT) in education: a review. Information systems design and intelligent applications. 2019:245–255.]. IoT allows them to exchange data, communicate with each other, and gather information from external sources [1111Chong JL, Chew KW, Peter AP, Ting HY, Show PL. Internet of Things (IoT)-Based Environmental Monitoring and Control System for Home-Based Mushroom Cultivation. Biosensors (Basel). 2023 Jan 6;13(1):98. doi: 10.3390/bios13010098. PMID: 36671933; PMCID: PMC9856179.], including data gathering, event transfer, network connectivity, decision making, responding to feedback, and interoperability [1212Hosenkhan MR, Pattanayak BK. Security issues in Internet of things (IoT): a comprehensive review. In: New Paradigm in Decision Science and Management. 2020;359–369.]. It has the potential to improve many aspects of life, including security, transportation, and health care [1313Munera D, Tobon V DP, Aguirre J, Gaviria Gomez N. IoT-based air quality monitoring system for smart cities: A systematic mapping study. Int J Electr Comput Eng. 2021;11(4):3470-3482.]. IoT is considered the internet of the future, with the potential to communicate billions of smart devices without human intervention [1414Tiwari A. Bibliometrics, Informetrics and Scientometrics: Opening New vistas of Information Science. Jaipur, India: Deepak Parnami RBSA Publishers; 2006;5-137.].
Bibliometrics was presented for the first study in 1917 by F. J. Cole & Nellie B. Eates about simply counting ways with the number of titles [1515Gayatri M. Bibliometric studies in the internet era. New Delhi, India: India Publishing House; 2009;1-98.-1717Almind TC, Ingwersen P. Informetric analyses on the World Wide Web: Methodological approaches to webometrics. J Articleation. 1997;53(4):404-426.]. It has already been widely applied in scientific production and research trend studies in many disciplines of science and engineering [1818Cronin B. Bibliometrics and beyond: Some thoughts on web-based citation analysis. J Inf Sci. 2001;27(1):1-7.-2121Nguyen MT. Bibliometric analyses in data-driven decision-making. In: Scrivener Publishing, India; 2025. p. 451-466.]. In 1969, Vassily V. Nalimove and Z.M. Mulchenko coined the Russian equivalent of the term as “Scientometric”, which has grown in popularity and is used to describe the study of science: growth, structure, interrelationships, and productivity [1616An AD. Measuring academic research: How to undertake a bibliometric study. Cambridge, UK: Chandos Publishing TBAC Business Centre; 2009;23-53.,1717Almind TC, Ingwersen P. Informetric analyses on the World Wide Web: Methodological approaches to webometrics. J Articleation. 1997;53(4):404-426.]. Bibliometric is a set of tools for analyzing publication data [2222Ziegler B. Methods for bibliometric analysis of research: Renewable energy case study. Cambridge, MA: Massachusetts Institute of Technology; 2009. 172.,2323Zhang GF, Xie SD, Ho YS. A bibliometric analysis of world volatile organic compounds research trends. Scientometrics. 2010;83(2):477-492.] and it is regarded as cannot be absent in investigation of information science field because of its strength in quantitative [1818Cronin B. Bibliometrics and beyond: Some thoughts on web-based citation analysis. J Inf Sci. 2001;27(1):1-7.,2222Ziegler B. Methods for bibliometric analysis of research: Renewable energy case study. Cambridge, MA: Massachusetts Institute of Technology; 2009. 172.] and qualitative analysis [22,24] to improve efficiency rates of information handling process [1515Gayatri M. Bibliometric studies in the internet era. New Delhi, India: India Publishing House; 2009;1-98.,2222Ziegler B. Methods for bibliometric analysis of research: Renewable energy case study. Cambridge, MA: Massachusetts Institute of Technology; 2009. 172.] and increase understanding of the information science research [1616An AD. Measuring academic research: How to undertake a bibliometric study. Cambridge, UK: Chandos Publishing TBAC Business Centre; 2009;23-53.,2222Ziegler B. Methods for bibliometric analysis of research: Renewable energy case study. Cambridge, MA: Massachusetts Institute of Technology; 2009. 172.]. Using bibliometrics is a tool in scientific research to estimate the scientific productivity of many categories as author, country, affiliation, journal title, keywords, etc. It describes the quantity of research and focuses on research output by a particular organization, which scientific output depends on the amount and type of information, which is selected for different purposes [2222Ziegler B. Methods for bibliometric analysis of research: Renewable energy case study. Cambridge, MA: Massachusetts Institute of Technology; 2009. 172.]. Therefore, in this research conducts calculation and estimation of scientific productivity to 1) describe and analyze scientific output of total research productivity, author, country to identify trend of Internet of Things articles in environmental monitoring field; 2) analyze scientific output of first author as well as their affiliation by year and country to find out distribution of research publication in different countries and years; 3) simulate spatial distribution of indipendent articles and cooperation articles to overview scientific publication on the world.
The whole data source is extracted from the SCOPUS database from 2011 to May 2025 with the term “Internet of Things in Environmental Monitoring,” including 2717 articles. It is used to locate publications containing these words in parts of titles, abstracts, contents, and keywords. Then, these 2717 articles are recorded and calculated with different types, including total scientific productivity, author, country, affiliation, and first author category.
With the bibliometric method, before calculating total research productivity needs to implement some steps as grouping all the articles originating from Hong Kong, China, and Taiwan are China, the United Kingdom as UK, the United States as USA, the Russian Federation as Russia, South Korea as Korea, and the United Arab Emirates as UAE.
Collaborative categories are determined when independent categories are assigned. Independent categories include one or many common authors who are designated as researchers. Collaborative categories include many different authors from one or multiple countries. A Geographic Information System is used to display the spatial distribution of research productivity of countries.
From 2717 articles on the Internet of Things in the environmental monitoring field are downloaded on the Scopus website. The whole database, after downloading, is calculated and analyzed for research outputs in 2011-2025. The results are presented as follows:
Research productivity in 2011-2025
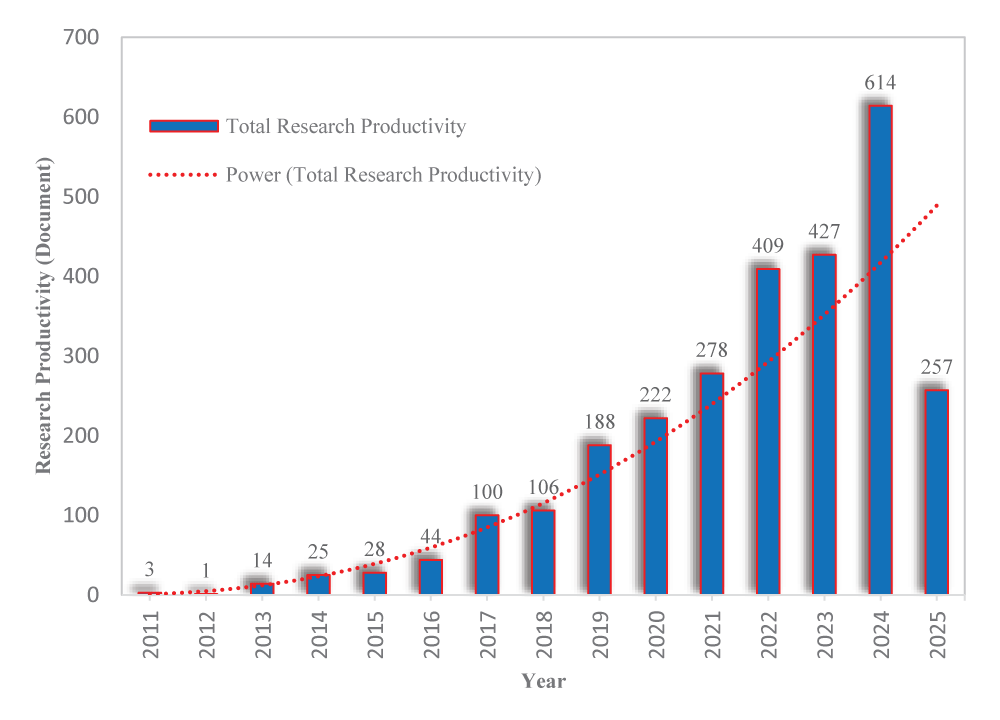
Research productivity in 2011-2025 is the total research output of authors who are published on the SCOPUS system. It includes 2717 articles with the least output in 2012 (1 article), next is 2011 with 3 articles, and this publication has trended slightly increasing. Following by 14 articles in 2013; 25 articles in 2014; 28 articles in 2015; 44 articles in 2016; 100 articles in 2017; 106 articles in 2018; 188 articles in 2019; 222 articles in 2020; 278 articles in 2021; 409 articles in 2022; 427 articles in 2023; 614 articles in 2024; and 257 articles in 2025, which is estimated on May, 2025. This stage is regarded as a sharp increasing trend. Especially, strong research publication growth is in 2022 (409 articles) and 2024, with 614 articles. When comparing research publications of the last ten years (2014), publication output in 2024 increases 24.5 times, and as Figure 1 shows clearly, it is an increasing research publication trend during 15 years and rises sharply in 2024.
Figure 1: Annual research publication in the Internet of Things article.
Scientific productivity of the author
An article includes an author or many co-authors in a scientific publication, in which the head of authors on the article is called the 1st author, and the remaining authors are cooperation author. Table 1 shows 20 authors who have the most scientific publications on the Internet of Things (IoT) from the environmental monitoring field from 2011 to 2025. It indicates that all the authors (20 authors) are Chinese, where Y. Wang has the most research publications with 33 articles (1st ranking), concluding 10 articles are the 1st author (30.3%) and 23 articles are co-author, accounting for 69.7%. The 2nd ranking is Y. Zhang, author with 28 articles, including 2 articles as the first author (7.1%) and 26 articles as cooperation co-author (92.9%). Following Y. Li is in 3rd ranking with 26 articles, of which 7 articles are by the first author (30.8%). Z. Wang has 25 articles in total research productivity (4th ranking) with 6 articles of the first author (24%) and 19 articles of cooperation author (76); Z. Zhang and H. Wang author have 23 articles (5th ranking) with 3 articles of first author (13%) and 20 articles of cooperative author (87%) at all; X. Wang, and J. Wang have 22 articles of total productivity, 6th ranking with different independent and cooperative articles. The 7th ranking is L. Liu and J. Li, authors with 21 articles, have 5-6 articles (23.8-28.6%) as first author and 15-16 articles as a cooperative author (71.4-76.2%). The 8th ranking is J. Zhang, Y. Liu, and X. Li, authors with 20 articles, who have 3-7 articles (15-35%) as first authors and 13-17 articles as cooperative authors (65-85%). Zhang and J. Yang, authors are 9th ranking with 19 articles, and the research publication is presented in Table 1. Y. Chen has 17 articles (10th ranking) with 5 articles (29.4%) as a first author and 12 articles (70.6%) as a cooperative author. X. Liu, author, has 16 articles, 11th ranking with 2 articles of FA and 14 articles of CA (87.5%). The final ranking (12th ranking) is Y. Zhou, H. Zhang, Z.L. Wang, with 15 articles, including 0-5 articles of FA, 10-15 articles of CA. However, it is only an author who has any independent articles as Z.L. Wang. Thus, Y. Wang author, has the most research output as the first author (10 articles) as well as total research productivity (33 articles), and Y. Zhang has the most cooperative articles (26 articles) during 2011-2025 of Internet of Things in environmental monitoring (Table 2).
Table 1: Annual scientific productivity of the first author in 2011-2025.
Table 2: Scientific productivity of the author in different categories during 2011-2025.
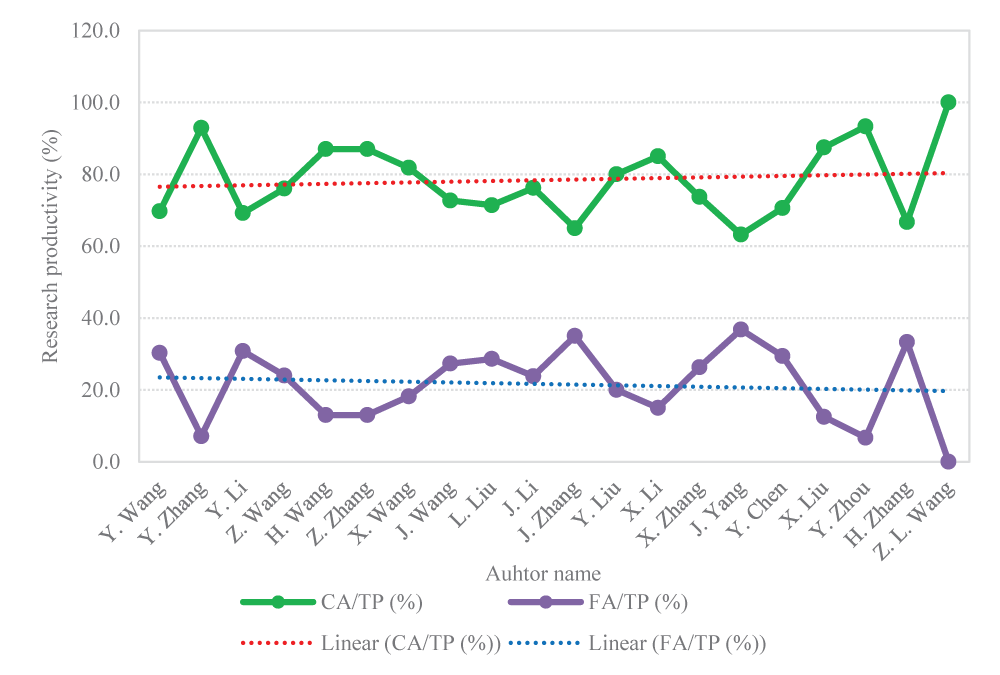
Based on 20 authors with the most research productivity to compare the rate between cooperative authors and and first author indicates that the trend of cooperative author is increasing, also with first author is decreasing trend. Figure 2 includes 20 authors and shows that Y. Zhang, H Zhang, Z. Zhang, Y. Liu, X. Li, Y. Zhou, and Z.L. Wang authors have a high cooperation rate in collaborative articles (85-93.3%), and in contrast, they have a low rate in first author articles (12.5-15%). However, with Y. Li, J. Zhang, J. Wang, and H. Zhang authors show a high first author rate (30-36.8%); in cooperation author articles, they have a low rate.
Figure 2: Trend of cooperation author and the author in the Internet of Things article.
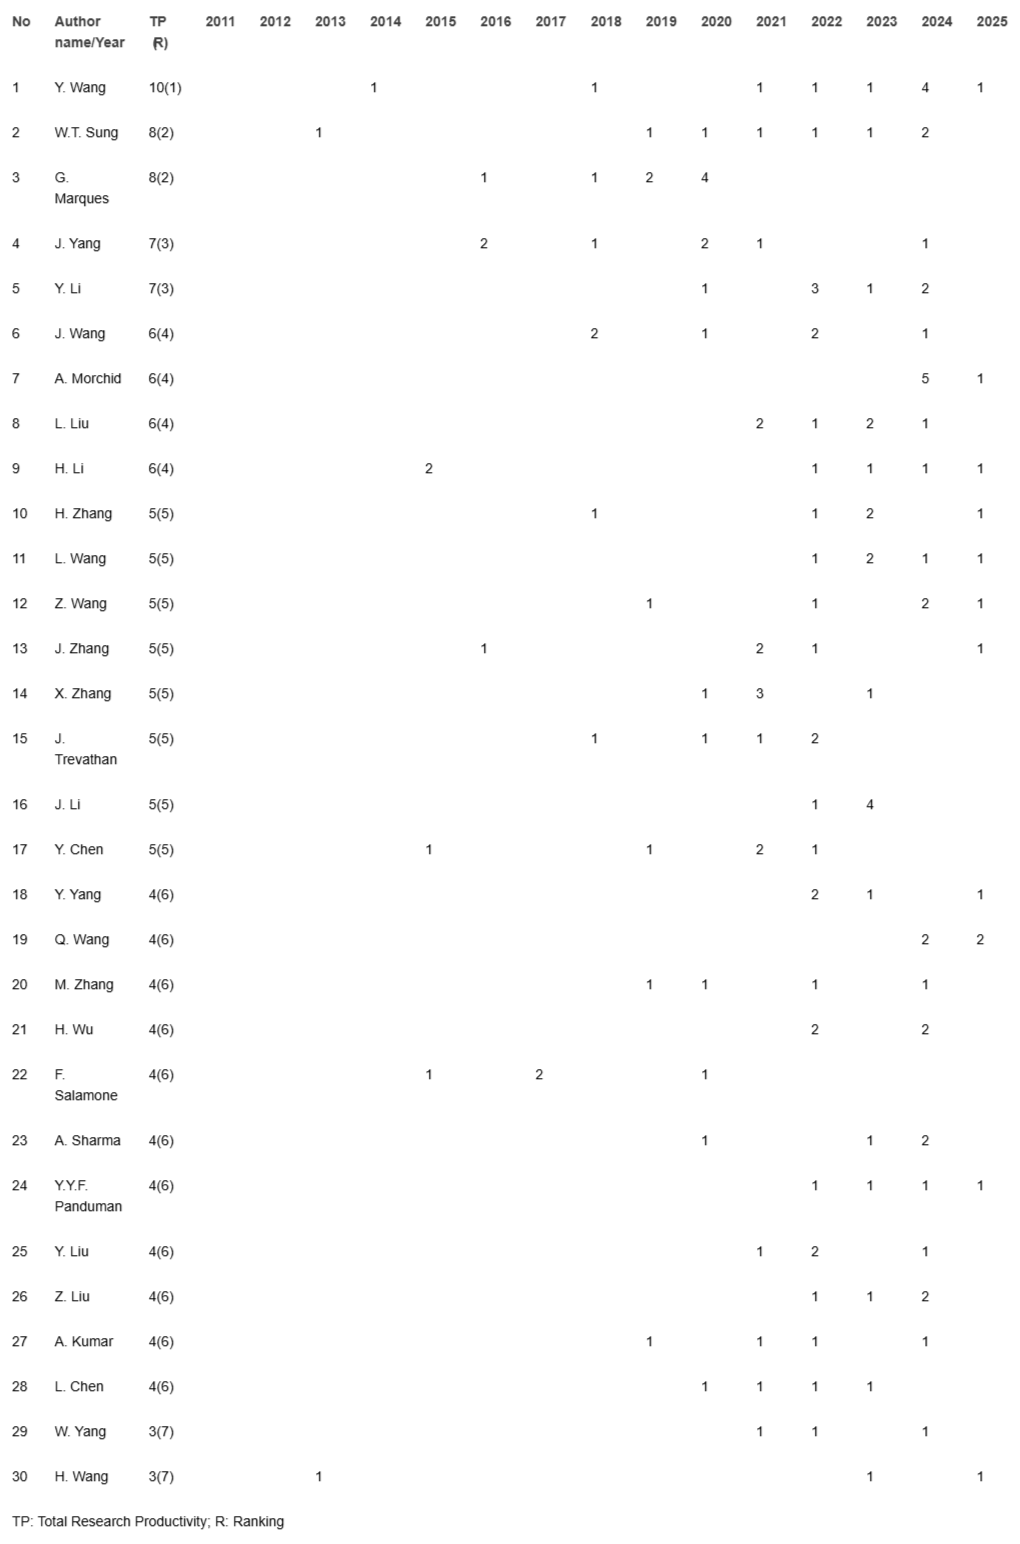
Research output of the first author
The first author normally stands at the head of the authors. 30 first authors with the most publications in 2011-2025 of Internet of Things are presented in Table 1, and it indicates that almost all authors published more in 2022-2024. First publication of authors from 2013, which means that in 2011 and 2012, they had not published in the Internet of Things field. Moreover, this first publication belongs to W.T. Sung and H. Wang, authors in 2013. In 2014, has only one author to start publication in the Internet of Things field as Y. Wang. Publication of authors gradually increases to 2021, and it sharply increases from 2022 to 2024. In 2025, are only a least one publication because of extracting data to May 2025. However, it is revealed publication of 11 authors in 30 first authors, in which Y. Wang has published continuously from 2021 to 2025, with annual publication of 1-4 articles. This continuous publication is also presented with W.T. Sung, author from 2019 – 2024; H. Li, L. Wang, and Y.Y.F. Panduman, authors from 2022-2015; L. Liu, author from 2021-2024; and L. Chen, author from 2019-2023. Furthermore, Table 1 also indicates the total research output of authors. Particularly, Y. Wang has the most publications with 10 articles in the 1st ranking. Following by W.T. Sung and G. Marques authors with 8 articles in 2nd ranking; 3rd ranking is J. Yang and Y. Li authors with 7 articles; 4th ranking is J. Wang, A. Morchid, H. Li, and L. Liu authors with 6 articles; with 5 articles in publication includes H. Zhang, L. Wang, Z. Wang, J. Zhang, X. Zhang, J. Trevathan, J. Li, and Y. Chen authors in the 5th ranking; the 6th ranking has many authors, including Y. Yang, Q. Wang, M. Zhang, H. Wu, F. Salamone, A. Sharma, Y.Y.F. Panduman, Y. Liu, Z. Liu, A. Kumar, and L. The Chen authors have 4 articles. Final ranking (7th ranking) is W. Yang and H. Wang authors with 3 articles. Besides, A. Morchid author, has the most publications in 2024 with 5 articles, while publication of 4 articles has Y. Wang, G. Marques, and J. Li authors, and it is distributed in 2024, 2020, and 2023. Thus, Y. Wang author, is 1st ranking in the first author with 10 articles and the least publications among 30 authors, as W. Yang and H. Wang authors with 3 articles (Table 1).
The scientific publication of the first author is also revealed by the countries. Table 3 includes 25 authors, who have the most output, and it is distributed in countries as Australia, Brazil, China, India, Japan, Morocco, Italy, Singapore, France, Portugal, the United Arab Emirates, United Kingdom, and United states, in which almost scientific output in Internet of Things is published in China. Particularly, Y. Wang, author with 10 articles, first ranking, has 9 articles, which were published in China, and 1 article publishes in the United Kingdom. Following by J. Yang with 6 articles in China and 1 article in United Kingdom; Y. Li author with 6 articles in China and 1 article in Japan; L. Liu author with 5 articles in China and 1 article in Singapore; H. Zhang author with 4 articles in China and 1 article in Australia; L. Wang with 4 articles in China and 1 article in United Arab Emirates; J. Li author with 4 articles in China and 1 article in United States; Y. Chen, author with 4 articles in China and 1 article in France; Y. Yang author with 3 articles in China and 1 article in United States; and Y. Liu with 3 articles in China and 1 article in Brazil. Moreover, some authors just publish in China without any other country, such as W.T. Sung with 8 articles; J. Wang and H. Li authors with 6 articles; Z. Wang, J. Zhang, and X. Zhang authors with 5 articles; Q. Wang, M. Zhang, and H. Wu authors with 4 articles. However, few authors publish in other countries, without China as G. Marques with 8 articles in Portugal; A. Morchid, author with 6 articles in Morocco; J. Trevathan with 5 articles in Australia; F. Salamone, author with 4 articles in Singapore; and Y.Y.F. Panduman with 4 articles in Japan. Additionally, it is only an author who publishes in two countries, without China, as A. Shama author with 3 articles in India and 1 article in Australia. Thus, Table 4 shows that almost publications in China and Y. Wang first author, has the most research output with 9 articles in China and 1 article in the United Kingdom. A. Shama, author, has not published in China, and it has been published in two countries as India and Australia (Table 3).
Table 3: Research productivity of the first author in different countries.
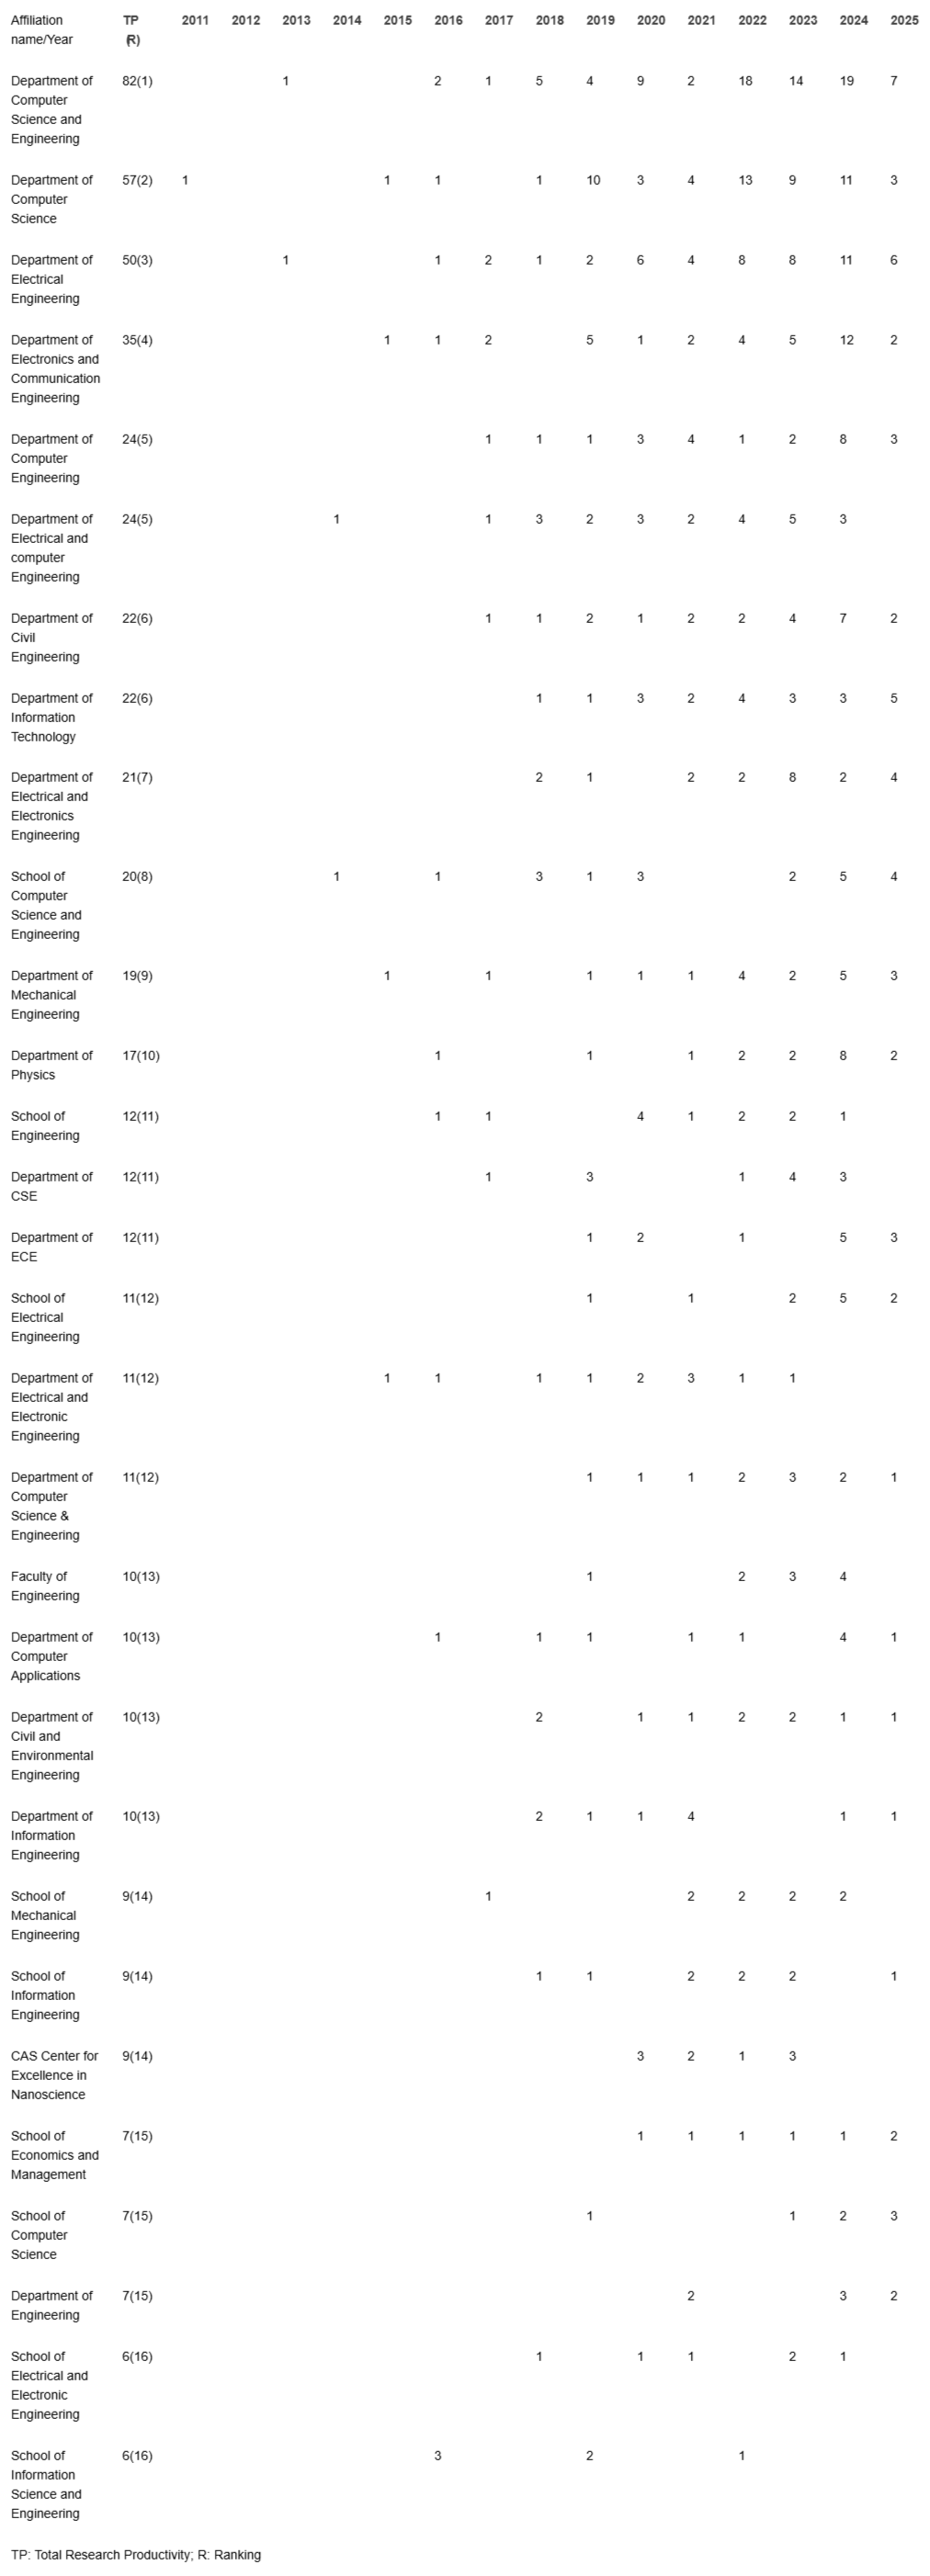
Table 4: Annual research publication of affiliation of the first author from 2011-2025.
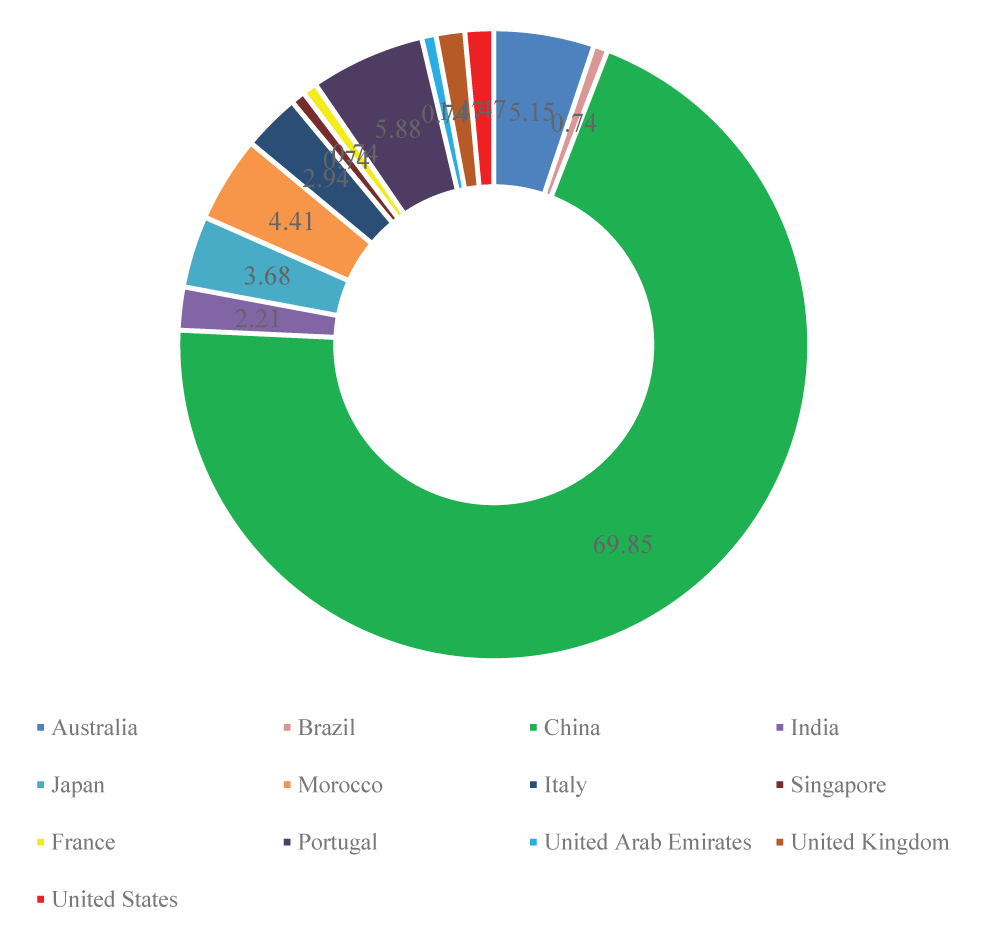
Among 25 authors with the most research productivity presents China occupies the highest rate of scientific output. Figure 3 indicates that the research output rate in China occupies 69.85% and is the highest rate. The remaining 12 countries are 21.15% in total research output rate, in which Australia is 5.15%, India 2.21%, Japan 3.68%, Morocco 4.41%, Italy 2.94%, Portugal 5.88%, the United Kingdom and the United States are 1.47%, Brazil, Singapore, and France are 0.74%. Thus, scientific publication with high productivity belongs to China.
Figure 3: Research rate of scientific productivity in China and other countries.
Affiliation of first author
The affiliation of the first author is paid attention to in this research, and its scientific productivity is presented in Table 4. It includes 30 affiliations and is published from 2011-2025. Its productivity shows that the Department of Computer Science and Engineering has the most research output with 82 articles and 1st ranking. Following by Department of Computer Science with 57 articles in 2nd ranking; Department of Electrical Engineering with 50 articles, 3rd ranking; Department of Electronics and Communication Engineering with 35 articles, 4th ranking; Department of Computer Engineering and Department of Electrical and computer Engineering affiliation with 24 articles in 5th ranking; 6th ranking is Department of Civil Engineering and Department of Information Technology with 22 articles; Department of Electrical and Electronics Engineering with 21 articles in 7th ranking; School of Computer Science and Engineering with 20 articles, 8th ranking; Department of Mechanical Engineering is 9th ranking with 19 articles; Department of Physics is 10th ranking with 17 articles; 11th ranking is School of Engineering, Department of CSE, and Department of ECE affiliations with 12 articles; 12th ranking is School of Electrical Engineering, Department of Electrical and Electronic Engineering, and Department of Computer Science & Engineering with 11 articles; 13th ranking has four affiliations as Faculty of Engineering, Department of Computer Applications, Department of Civil and Environmental Engineering, and Department of Information Engineering with 10 articles; 14th ranking has three affiliations as School of Mechanical Engineering, School of Information Engineering, and CAS Center for Excellence in Nanoscience with 9 articles; 15th ranking is School of Economics and Management, School of Computer Science, and Department of Engineering affiliations with 7 articles; and final ranking (16th ranking) in Table 4 includes School of Electrical and Electronic Engineering affiliation and School of Information Science and Engineering affiliation with 6 articles. Moreover, the scientific productivity of affiliations also reveals that some affiliations publish Internet of Things articles at the initial stage (2011-2018), and almost all affiliations are published in 2019-2025. Particularly, publication in 2011 has only an affiliation with Department of Computer Science. There is not any publication of affiliations in 2012, and in 2013 has two affiliations as Department of Computer Science and Engineering affiliation and the Department of Electrical Engineering affiliation. In 2014, it had two affiliations, including the Department of Electrical and Computer Engineering affiliation and the School of Computer Science and Engineering. These productivity increases gradually from 2015 to 2025, and it is presented in Table 4. Especially, this publication has seen a strong increase in 2022-2024, such as the Department of Computer Science and Engineering starting to publish in 2013 with 1 article, and it has 14-19 articles in 2022-2024. Department of Computer Science published 1 article in 2011 and has the earliest publication among 30 affiliations. From 2022 to 2024 increases sharply, with 9-13 articles, and Department of Electrical Engineering has its first publication in 2013, and it increases sharply in 2022-2024 with 8-11 articles (Table 4).
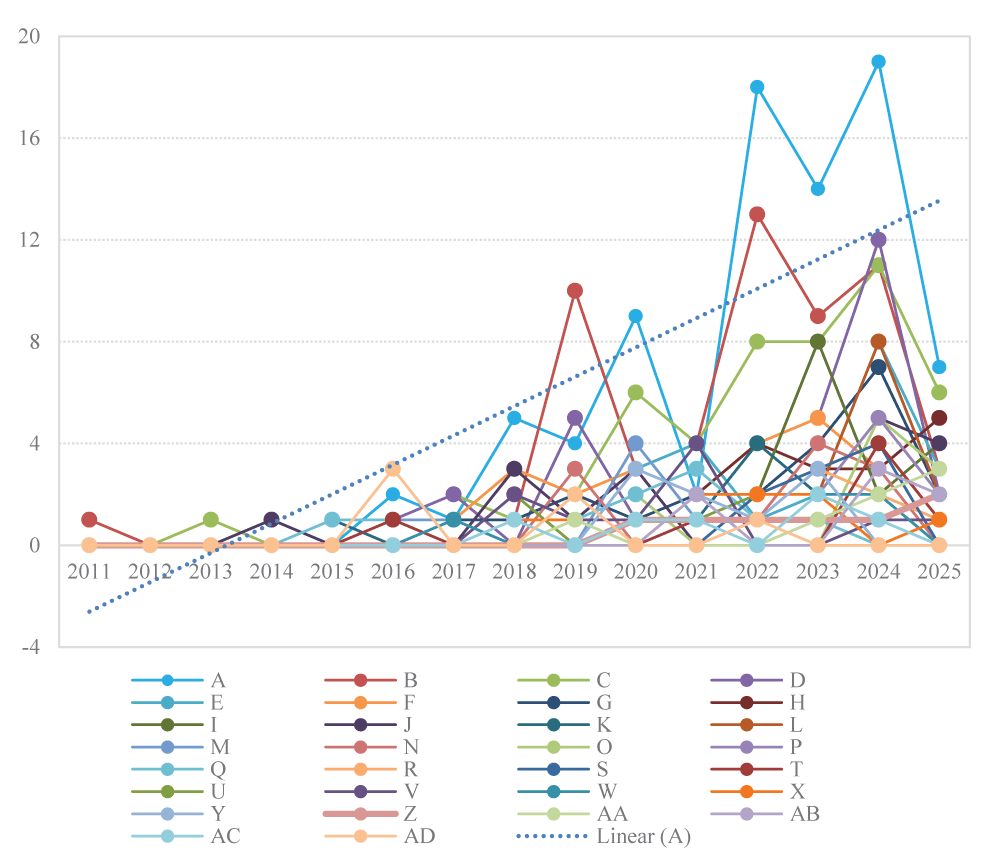
Via 30 affiliations with the most research productivity from 2011-2025 reveals an increasing trend when considering from School of Information Science and Engineering affiliation to the Department of Computer Science and Engineering affiliation. Figure 4 is annual research publication from 2011 to 2025 of affiliaitons in Internet of Things field with Department of Computer Science and Engineering (A), Department of Computer Science (B), Department of Electrical Engineering (C), Department of Electronics and Communication Engineering (D), Department of Computer Engineering (E), Department of Electrical and computer Engineering (F), Department of Civil Engineering (G), Department of Information Technology (H), Department of Electrical and Electronics Engineering (I), School of Computer Science and Engineering (J), Department of Mechanical Engineering (K), Department of Physics (L), School of Engineering (M), Department of CSE (N), Department of ECE (O), School of Electrical Engineering (P), Department of Electrical and Electronic Engineering (Q), Department of Computer Science & Engineering (R), Faculty of Engineering (S), Department of Computer Applications (T), Department of Civil and Environmental Engineering (U), Department of Information Engineering (V), School of Mechanical Engineering (W), School of Information Engineering (X), CAS Center for Excellence in Nanoscience (Y), School of Economics and Management (Z), School of Computer Science (AA), Department of Engineering (AB), School of Electrical and Electronic Engineering (AC), and School of Information Science and Engineering (AD) affilitions indicate that Department of Computer Science and Engineering has the most publication, especial in 2022 and 2024 year. Moreover, low publication in head years of the stage, and it has sharp increased from 2019 year. Generally, scientific output has increasing trend from 2011 to 2025 with Internet of Things (IoT) articles.
Figure 4: Reseach publication rend of Internet of Things (IoT) in 2011-2025.
Besides, the research productivity of the first author is also revealed across countries in the world. Table 5 includes 10 affiliations, which have the most scientific output and are distributed across the country. Particular, Department of Computer Science and Engineering affiliation (A) has 82 articles of total scientific output with 1st ranking, including 2 articles in Bangladesh, 2 articles in China, 66 articles in India, 3 articles in Italy, 5 articles in Korea, 1 article in Spain, 2 articles in United Arab Emirates, and 1 article in United States. 2nd ranking is Department of Computer Science (B) with 57 articles, concluding 5 articles in China, 1 article in Cyprus, 1 article in Egypt, 1 article in Finland, 9 articles in India, 2 articles in Iraq, 1 article in Italy, 2 articles in Jordan, 1 article in Kuwait, 1 article in Malaysia, 2 articles in Morocco, 6 articles in Pakistan, 1 article in Poland, 5 articles in Saudi Arabia, 1 article in Spain, 2 United Arab Emirates, 4 articles in United Kingdom, 7 articles in United States, and 1 article in Zambia. Department of Electrical Engineering (C) is 3rd raking with 50 articles and distributed in Brazil (1 article), China (18 articles), Cyprus (1 article), India (3 articles), Indonesia (11 articles), Iran (1 article), Iraq (1 article), Italy (1 article), Malaysia (1 article), Pakistan (9 articles), Qatar (1 article), Saudi Arabia (1 article), and Korea (1 article). The 4th ranking is the Department of Electronics and Communication Engineering (D) with 35 articles in India. Next ranking has 24 articles as Department of Computer Engineering (E) with 1 article in India, 6 articles in Iran, 2 articles in Iraq, 1 article in Kazakhstan, 1 article in Pakistan, 7 articles in Saudi Arabia, 2 articles in Korea, 1 article in Sri Lanka, and 3 articles in Turkey and affiliation of Department of Electrical Computer Engineering (F) with 1 article in Bangladesh, 5 articles in Canada, 1 article in Greece, 1 article in Namibia, 1 article in Pakistan, 2 articles in Korea, 2 articles in Turkey, and 9 articles in United States. 6th ranking is Department of Civil Engineering (G) with 22 articles, in which 1 article in Canada, 4 articles in China, 10 articles in India, 1 article in Indonesia, 1 article in Kazakhstan, 1 article in Pakistan, 2 articles in Saudi Arabia, 1 article in Korea, 1 article in Turkey and affiliation of Department of Information Technology (H) has 22 articles too, including 1 article in Belgium, 2 articles in China, 12 articles in India, 2 articles in Iran, 1 article in Iraq, 1 article in Saudi Arabia, 1 article in Somalia, and 1 article in Sri Lanka. Department of Electrical and Electronics Engineering (I) has 21 articles, 7th ranking, concluding 1 article in Greece, 16 articles in India, 1 article in Iran, 1 article in Malaysia, 1 article in Oman, and 1 article in Turkey. Final ranking is School of Computer Science and Engineering (J) with 20 articles and distributed in three countries as China (5 articles), India (14 articles), and Singapore with 1 article. Thus, from 10 affiliations have the most research output and distributed in countries show that the most scientific output of affiliation belongs to India, next is China.
Table 5: Scientific publication of the first author affiliation in different countries.
Research publication of the country
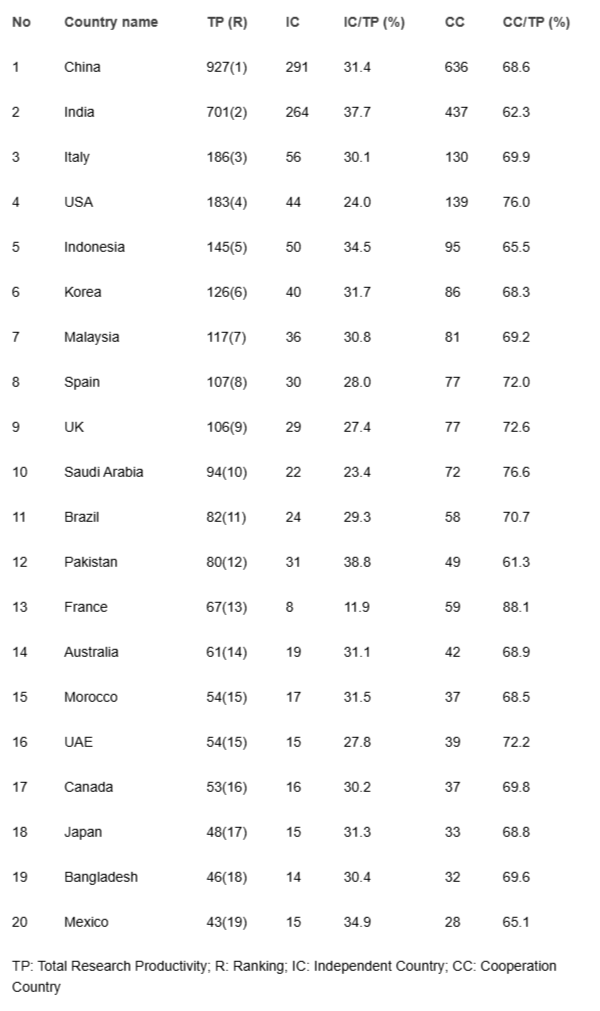
In the estimation of Internet of Things (IoT) articles in the environmental monitoring field on SCOPUS, the country category gives us access to be known scientific output of independent countries and cooperation country. Basing on 2717 articles in Internet of Thing during 2011-2025, this research is estimated out top 20 countries, where have the highest publication output. It is demonstrated in Table 6 and indicated that China is 1st place with research output of 927 articles, with 291 articles of independent articles (31.4%) and 636 articles of collaborative articles (68.6%). The 2nd ranking is India with 701 articles, whereas it has 264 articles of independent articles (37.7%) and 437 articles of collaborative articles (62.3%). Italy country is ranked third with 186 articles, including 56 articles of independent articles (30.1%), and 130 articles of collaborative articles (69.9%). The ranking list is followed by USA 183 articles (4th ranking); Indonesia 145 articles (5th ranking); Korea (6th ranking with 126 articles); Malaysia 117 articles with 7th ranking; Spain 107 articles (8th ranking); United Kingdom 106 articles with 9th ranking; Saudi Arabia 94 articles (10th ranking); Brazil 82 articles (11th ranking); Pakistan 80 articles with 12th ranking; France 67 articles with 13th ranking; Australia 61 articles with 14th ranking; Morocco and United Arap Emirates have the same scientific output as 54 articles with 15th ranking; Canada 53 articles with 16th ranking; Japan 48 articles with 17th ranking; Bangladesh is 18th ranking with 46 articles and Mexico is final ranking with 43 articles as well as research publication of independent country and collaborative country is presented in Table 6. Thus, from top 20 countries have the most scientific productivity and demonstrate that China has the most total research productivity with first ranking in independent articles, collaborative articles, and total productivity in Internet of Things articles on SCOPUS (Table 6).
Table 6: Research output of the country with different categories in 2011-2025.
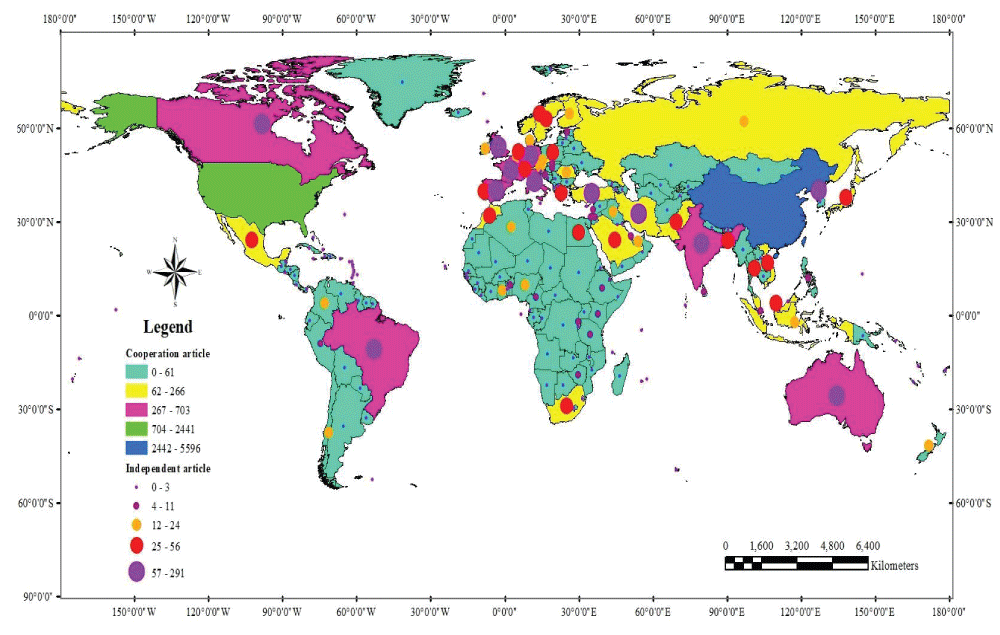
The world map displays the distribution of scientific output by countries. It is displayed in a different color to distinguish research publications from countries. Figure 5 below presents spatial distribution of independent article and collaborative article via countries on the world. It indicates distribution of more scientific output is belongs to China (2442-5596 articles) with ocean blue color in cooperation articles. Next is the United States (704-2441 articles) with green color; pink color belongs to Canada, Brazil, Australia, and India with 267-703 articles. Countries, where has 62-266 articles is displayed in yellow color of cooperation article, and 0-61 cooperation articles are distributed in countries via blue color. Moreover, distribution of independent articles is classed by 5 classes, including 0-3 articles (yellow-orange color); 4-11 articles (red-purple color); 12-24 articles (orange color); 25-56 articles (red color); and purple color is 57-291 articles. Especially, more research publication (purple color) of independent articles belongs to India, China, Australia, Brazil, Canada, and some countries in Europe (Figure 5).
Figure 5: Distribution of scientific productivity in the Internet of Things in the world.
From 2717 articles published on Scopus of Internet of Things in the environmental monitoring field during 2011-2025, some signification points are drawn as total research productivity is an increasing trend and it increases sharply from 2022 and 2024. Y. Wang author, has the most research output in the first author (10 articles) and total research productivity (33 articles). Y. Zhang has the most cooperation articles (26 articles). A. Morchid author has the most publication in 2024 with 5 articles while publication of 4 articles has Y. Wang, G. Marques, J. Li authors and it is distributed in 2024, 2020, and 2023 year. Almost scientific output is published in China and Y. Wang first author has the most research output with 9 articles in China and 1 article in United Kingdom. A. Shama author has not published in China but it is published in two countries as India with 3 articles and Australia with 1 article. Publication of affiliations sharp increases in 2022-2025 and Department of Computer Science and Engineering affiliation has the most research output with 82 articles in 2011-2025. The most research output of affiliations distributes mainly in China, then is India. In distribution of country, China has the most total research productivity with first ranking in independent article, collaborative article, and total productivity in Internet of Things articles on SCOPUS.
Rajesh GM, Gomadhi G, Malathi J, Namdeoo Nehul A, Krishnaveni. Innovative pathways in environmental monitoring and advanced technologies for sustainable resource management. J Environ Rep. 2019;17-20.
Environmental monitoring: A guide to ensuring a successful mobile IoT deployment. 2018.
Laha SR, Pattanayak BK, Pattnaik S. Advancement of environmental monitoring system using IoT and sensor: A comprehensive analysis. AIMS Environ Sci. 2022;9(6):771-800.
Ashton K. That “internet of things” thing. RFID J. 2009;22(7):97-114.
Ramlowat DD, Pattanayak BK. Exploring the Internet of things (IoT) in education: a review. Information systems design and intelligent applications. 2019:245–255.
Chong JL, Chew KW, Peter AP, Ting HY, Show PL. Internet of Things (IoT)-Based Environmental Monitoring and Control System for Home-Based Mushroom Cultivation. Biosensors (Basel). 2023 Jan 6;13(1):98. doi: 10.3390/bios13010098. PMID: 36671933; PMCID: PMC9856179.
Hosenkhan MR, Pattanayak BK. Security issues in Internet of things (IoT): a comprehensive review. In: New Paradigm in Decision Science and Management. 2020;359–369.
Munera D, Tobon V DP, Aguirre J, Gaviria Gomez N. IoT-based air quality monitoring system for smart cities: A systematic mapping study. Int J Electr Comput Eng. 2021;11(4):3470-3482.
Tiwari A. Bibliometrics, Informetrics and Scientometrics: Opening New vistas of Information Science. Jaipur, India: Deepak Parnami RBSA Publishers; 2006;5-137.
Gayatri M. Bibliometric studies in the internet era. New Delhi, India: India Publishing House; 2009;1-98.
An AD. Measuring academic research: How to undertake a bibliometric study. Cambridge, UK: Chandos Publishing TBAC Business Centre; 2009;23-53.
Almind TC, Ingwersen P. Informetric analyses on the World Wide Web: Methodological approaches to webometrics. J Articleation. 1997;53(4):404-426.
Cronin B. Bibliometrics and beyond: Some thoughts on web-based citation analysis. J Inf Sci. 2001;27(1):1-7.
Li JF, Wang MH, Ho YS. Trends in research on global climate change: A Science Citation Index Expanded based analysis. J Global Planet Change. 2011;77:13-20.
Ho YS. Bibliometric analysis of adsorption technology in environmental science. J Environ Prot Sci. 2007;1(1):1-11.
Nguyen MT. Bibliometric analyses in data-driven decision-making. In: Scrivener Publishing, India; 2025. p. 451-466.
Ziegler B. Methods for bibliometric analysis of research: Renewable energy case study. Cambridge, MA: Massachusetts Institute of Technology; 2009. 172.
Zhang GF, Xie SD, Ho YS. A bibliometric analysis of world volatile organic compounds research trends. Scientometrics. 2010;83(2):477-492.
Nguyen MT. Scientific Productivity of the Internet of Things (IoT) in 2011-2025: A Bibliometric Analysis. IgMin Res. August 26, 2025; 3(8): 324-334. IgMin ID: igmin313; DOI:10.61927/igmin313; Available at: igmin.link/p313
Vietnam Institute of Meteorology, Hydrology, and Climate Change, Vietnam
Address Correspondence: Minh Thu Nguyen, Vietnam Institute of Meteorology, Hydrology, and Climate Change, Vietnam, Email: [email protected]
How to cite this article: Nguyen MT. Scientific Productivity of the Internet of Things (IoT) in 2011-2025: A Bibliometric Analysis. IgMin Res. August 26, 2025; 3(8): 324-334. IgMin ID: igmin313; DOI:10.61927/igmin313; Available at: igmin.link/p313
Rajesh GM, Gomadhi G, Malathi J, Namdeoo Nehul A, Krishnaveni. Innovative pathways in environmental monitoring and advanced technologies for sustainable resource management. J Environ Rep. 2019;17-20.
Environmental monitoring: A guide to ensuring a successful mobile IoT deployment. 2018.
Laha SR, Pattanayak BK, Pattnaik S. Advancement of environmental monitoring system using IoT and sensor: A comprehensive analysis. AIMS Environ Sci. 2022;9(6):771-800.
Ashton K. That “internet of things” thing. RFID J. 2009;22(7):97-114.
Ramlowat DD, Pattanayak BK. Exploring the Internet of things (IoT) in education: a review. Information systems design and intelligent applications. 2019:245–255.
Chong JL, Chew KW, Peter AP, Ting HY, Show PL. Internet of Things (IoT)-Based Environmental Monitoring and Control System for Home-Based Mushroom Cultivation. Biosensors (Basel). 2023 Jan 6;13(1):98. doi: 10.3390/bios13010098. PMID: 36671933; PMCID: PMC9856179.
Hosenkhan MR, Pattanayak BK. Security issues in Internet of things (IoT): a comprehensive review. In: New Paradigm in Decision Science and Management. 2020;359–369.
Munera D, Tobon V DP, Aguirre J, Gaviria Gomez N. IoT-based air quality monitoring system for smart cities: A systematic mapping study. Int J Electr Comput Eng. 2021;11(4):3470-3482.
Tiwari A. Bibliometrics, Informetrics and Scientometrics: Opening New vistas of Information Science. Jaipur, India: Deepak Parnami RBSA Publishers; 2006;5-137.
Gayatri M. Bibliometric studies in the internet era. New Delhi, India: India Publishing House; 2009;1-98.
An AD. Measuring academic research: How to undertake a bibliometric study. Cambridge, UK: Chandos Publishing TBAC Business Centre; 2009;23-53.
Almind TC, Ingwersen P. Informetric analyses on the World Wide Web: Methodological approaches to webometrics. J Articleation. 1997;53(4):404-426.
Cronin B. Bibliometrics and beyond: Some thoughts on web-based citation analysis. J Inf Sci. 2001;27(1):1-7.
Li JF, Wang MH, Ho YS. Trends in research on global climate change: A Science Citation Index Expanded based analysis. J Global Planet Change. 2011;77:13-20.
Ho YS. Bibliometric analysis of adsorption technology in environmental science. J Environ Prot Sci. 2007;1(1):1-11.
Nguyen MT. Bibliometric analyses in data-driven decision-making. In: Scrivener Publishing, India; 2025. p. 451-466.
Ziegler B. Methods for bibliometric analysis of research: Renewable energy case study. Cambridge, MA: Massachusetts Institute of Technology; 2009. 172.
Zhang GF, Xie SD, Ho YS. A bibliometric analysis of world volatile organic compounds research trends. Scientometrics. 2010;83(2):477-492.


 Scan and get link