IGMIN: We're glad you're here. Please click 'create a new query' if you are a new visitor to our website and need further information from us.
If you are already a member of our network and need to keep track of any developments regarding a question you have already submitted, click 'take me to my Query.'
Welcome to IgMin Research – an Open Access journal uniting Biology, Medicine, and Engineering. We’re dedicated to advancing global knowledge and fostering collaboration across scientific fields.
At IgMin Research, we bridge the frontiers of Biology, Medicine, and Engineering to foster interdisciplinary innovation. Our expanded scope now embraces a wide spectrum of scientific disciplines, empowering global researchers to explore, contribute, and collaborate through open access.
Welcome to IgMin, a leading platform dedicated to enhancing knowledge dissemination and professional growth across multiple fields of science, technology, and the humanities. We believe in the power of open access, collaboration, and innovation. Our goal is to provide individuals and organizations with the tools they need to succeed in the global knowledge economy.
IgMin Publications Inc., Suite 102, West Hartford, CT - 06110, USA
This research used the calculating method of dry deposition to estimate SO2 dry deposition value and evaluate its trend in 5 recent years. The results indicate that SO2 emission at Northern sites is more changing than Southern ones in months by affecting meteorology and weather. Summer and autumn seasons have SO2 emitted concentrations higher than other seasons in 2019, 2020, and 2022 year at Yen Bai, Hoa Binh, and Ha Noi stations. The 2021 year has the highest SO2 dry deposition and the 2019 year has the lowest SO2 dry deposition in 5 recent years. The Hanoi site has the highest SO2 dry deposition value from 2019 to 2022 year. Hoa Binh site has the highest SO2 dry deposition at 2.45 kg/ha/year in 2023. High SO2 dry deposition occurs normally in the summer and autumn (from April to August). Southern sites have lower SO2 dry deposition amounts with not much change than the Northern sites of Vietnam. The increasing trend of SO2 dry deposition happened from 1999 to 2023 year and it increases sharply from 1999 to 2021. Therefore, SO2 dry deposition will have a light-increasing trend in the future.
Acid deposition is one of the serious environmental pollution issues because it is formed in polluted atmospheric conditions due to excessive gas emissions from industrial waste sources. Acid deposition includes wet and dry deposition, in which wet deposition is collected through rainy water, and dry deposition is drawn from the air via monitoring stations. The dry deposition process controls the transfer of pollutants from the atmosphere to the surface [1]. In a dry deposition, acid substances exist under the gas form or dust particles and are emitted from natural sources such as volcanoes [2] and artificial sources including industry, energy, land-based transport, shipping, and biomass-burning [2-4]. They are blown by the wind, then fall down the ground, and trees and enter the river system. Sulfur dioxide is emitted from. Dry deposition depends so much on wind speed, temperature, humidity, solar radiation, precipitation amount, and cloud cover factors. Moreover, dry deposition normally is represented by strong acids, which can dissolve metal oxides and dust in the air and soil leading to reduce the pH of water when raining. This acid deposition causes crop damage and reduces productivity, threatening animal and plant living, and affecting human health.
Acid concentration monitoring in the air is one of the basic monitoring items in EANET [5]. EANET is an international organization of Acid Deposition Monitoring Network in East Asia with the cooperation of 13 countries with Vietnam as one of the participants and the acid deposition system has been operating for 25 years. Monitoring stations in Vietnam are covered from the North to South of Vietnam whereas dry deposition stations include 5 stations and are monitored frequently, weekly. Origin data is sent to EANET yearly to save and publish on the EANET website. However, publication data have only each year and it has not revealed the trend of acid deposition in many years. Furthermore, the estimation of dry deposition is calculated by multiplying measured concentrations and deposition velocities [6-8]. Therefore, this research estimates sulfur dioxide gas dry deposition in 5 recent years and displays the trend of sulfur dioxide gas from the 2019-2023 year to understand the changing of sulfur dioxide gas dry deposition in 5 years. This research helps planners to take out environmental policy and make plans to reduce gas emissions into the air.
This study uses the inferential method to estimate sulfur dioxide gas dry deposition based on the equation [9,10] as follows:
Whereas:
Fi is the dry deposition of SO2 gas type
Vd is the deposition velocity of SO2 gas type
Ci is the atmospheric concentration of SO2 gas type.
Deposition velocity Vd is applied by the resistance model [8,11] and considering meteorological factors, deposition surface, and land use [10] to estimate deposition velocity. It is presented by the following equation:
Whereas:
Vd is the deposition velocity
Ra is the aerodynamic resistance
Rb is the quasi-laminar layer resistance
Rc is the surface resistance
The Ra and Rb parameters are calculated by the parameterizations of Erisman and Draaijers [12]. Rc is estimated by the equation of Wesely and Erisman [13] including stomal parameter, mesophyll, and surface resistance parameters. Data for wind speed, temperature, relative humidity, solar radiation, and precipitation are surveyed at the monitoring stations and used in calculating Vd.
Total SO2 concentration data are collected from monitoring stations and calculated SO2 dry deposition for all of Vietnam. The trend of SO2 dry deposition is presented in 5 years, from 2019 to 2023 years.
Concentration of SO2 gas
From monitoring stations in Vietnam, data on SO2 concentration is extracted and indicated that SO2 emitted concentration is about 0.06 ppb to 0.75 ppb for all years. Vietnam’s weather normally is separated into four seasons, including spring season, summer, autumn, and winter season. However, Southern Vietnam due to its geographic location is near the equator, so the temperature is higher, and sunny days are more than in Northern Vietnam, from that it forms 4 undistinctive seasons, which are the dry season and rainy season. Nevertheless, this research depends still on the 4 seasons of Northern to evaluate the emission of SO2 gas and estimate its dry deposition.
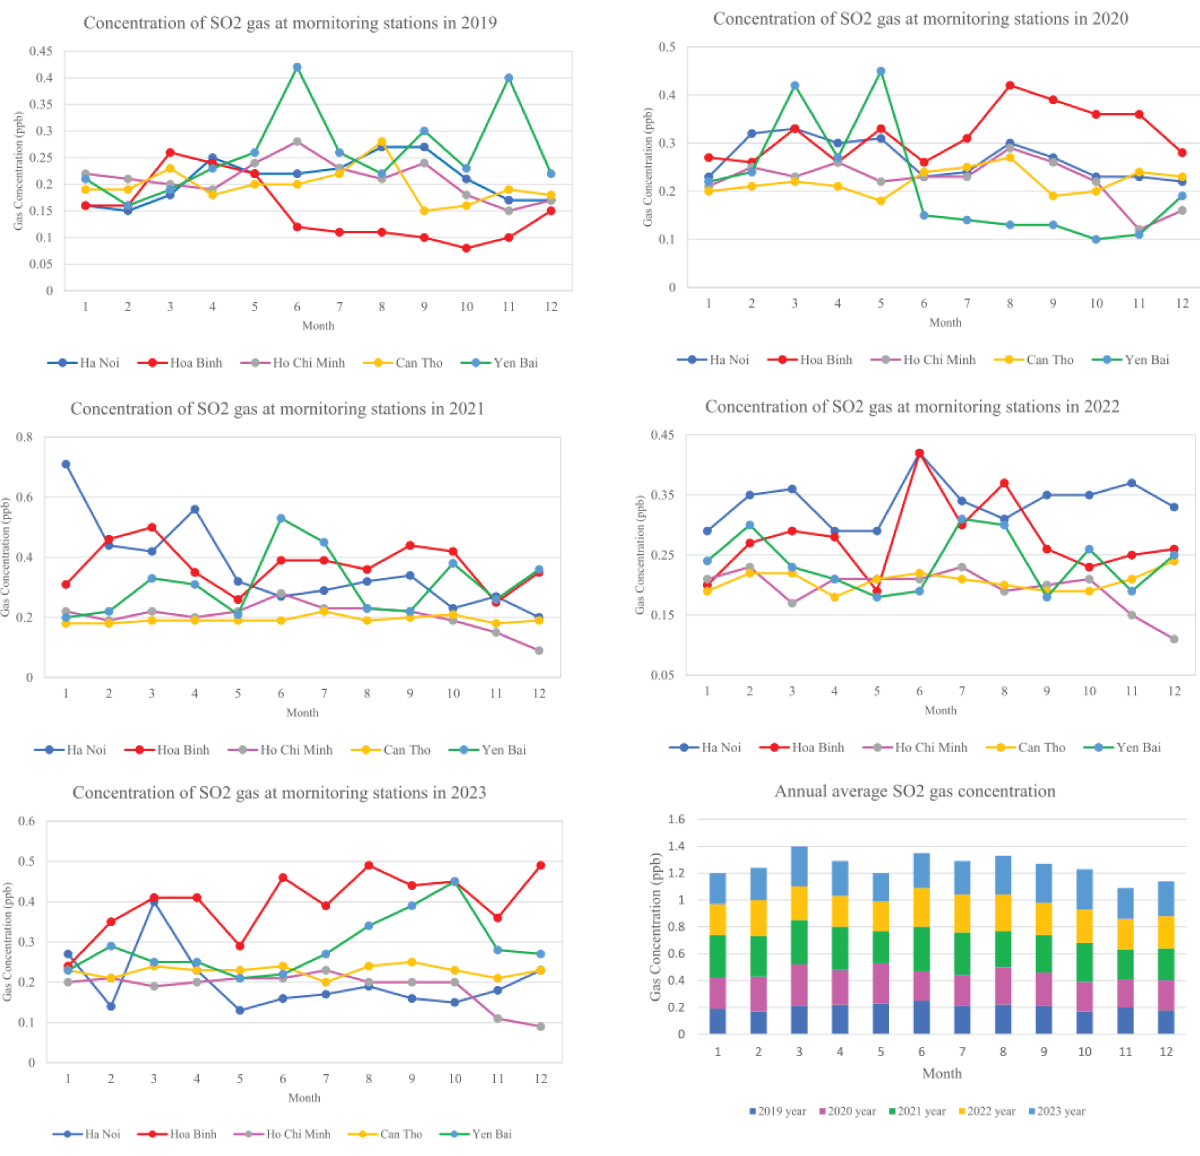
Figure 1 and Table 1 show that SO2 emission at Northern sites is more changing than at Southern ones in months by being affected by meteorology and weather. Moreover, the summer and autumn seasons have SO2 emitted concentrations higher than other seasons in 2019, 2020, and 2022 year at Yen Bai, Hoa Binh, and Ha Noi stations, especially in June and August due to this time weather is normally hot and dry, leading to increase temperature, reduce humidity, diminishing SO2 dry deposition by raining, from that causing SO2 concentration is more spreading into the air. In contrast, the spring season has high humidity and lower temperature making the existence of SO2 in the air shorter, therefore SO2 concentration is lower than in other seasons. Furthermore, nowadays, winter time is not long and cold because of climate change and it also appears more rainy in the winter, especially in the Southern parts rain occurs with high intensity leading to lower SO2 concentration in the air as well. In addition to climate change in recent times, SO2 concentration has changed unordinary at the Hanoi site in the spring with high SO2 concentration. Generally, SO2 concentration at sites monthly has changed clearly, especially in 2019 and 2022 years.
Figure 1: Changing of SO2 concentration at stations in Vietnam.
Table 1: Concentration of SO2 gas at stations in Vietnam (unit: ppb).
Station/month
1
2
3
4
5
6
7
8
9
10
11
12
Sum
2019
Ha Noi
0.16
0.15
0.18
0.25
0.22
0.22
0.23
0.27
0.27
0.21
0.17
0.17
2.5
Hoa Binh
0.16
0.16
0.26
0.24
0.22
0.12
0.11
0.11
0.1
0.08
0.1
0.15
1.81
Ho Chi Minh
0.22
0.21
0.2
0.19
0.24
0.28
0.23
0.21
0.24
0.18
0.15
0.17
2.52
Can Tho
0.19
0.19
0.23
0.18
0.2
0.2
0.22
0.28
0.15
0.16
0.19
0.18
2.37
Yen Bai
0.21
0.16
0.19
0.23
0.26
0.42
0.26
0.22
0.3
0.23
0.4
0.22
3.1
Station/month
1
2
3
4
5
6
7
8
9
10
11
12
Sum
2020
Ha Noi
0.23
0.32
0.33
0.3
0.31
0.23
0.24
0.3
0.27
0.23
0.23
0.22
3.21
Hoa Binh
0.27
0.26
0.33
0.26
0.33
0.26
0.31
0.42
0.39
0.36
0.36
0.28
3.83
Ho Chi Minh
0.21
0.25
0.23
0.26
0.22
0.23
0.23
0.29
0.26
0.22
0.12
0.16
2.68
Can Tho
0.2
0.21
0.22
0.21
0.18
0.24
0.25
0.27
0.19
0.2
0.24
0.23
2.64
Yen Bai
0.22
0.24
0.42
0.27
0.45
0.15
0.14
0.13
0.13
0.1
0.11
0.19
2.55
Station/month
1
2
3
4
5
6
7
8
9
10
11
12
Sum
2021
Ha Noi
0.71
0.44
0.42
0.56
0.32
0.27
0.29
0.32
0.34
0.23
0.27
0.2
4.37
Hoa Binh
0.31
0.46
0.5
0.35
0.26
0.39
0.39
0.36
0.44
0.42
0.25
0.35
4.48
Ho Chi Minh
0.22
0.19
0.22
0.2
0.22
0.28
0.23
0.23
0.22
0.19
0.15
0.09
2.44
Can Tho
0.18
0.18
0.19
0.19
0.19
0.19
0.22
0.19
0.2
0.21
0.18
0.19
2.31
Yen Bai
0.2
0.22
0.33
0.31
0.21
0.53
0.45
0.23
0.22
0.38
0.26
0.36
3.7
Station/month
1
2
3
4
5
6
7
8
9
10
11
12
Sum
2022
Ha Noi
0.29
0.35
0.36
0.29
0.29
0.42
0.34
0.31
0.35
0.35
0.37
0.33
4.05
Hoa Binh
0.2
0.27
0.29
0.28
0.19
0.42
0.3
0.37
0.26
0.23
0.25
0.26
3.32
Ho Chi Minh
0.21
0.23
0.17
0.21
0.21
0.21
0.23
0.19
0.2
0.21
0.15
0.11
2.33
Can Tho
0.19
0.22
0.22
0.18
0.21
0.22
0.21
0.2
0.19
0.19
0.21
0.24
2.48
Yen Bai
0.24
0.3
0.23
0.21
0.18
0.19
0.31
0.3
0.18
0.26
0.19
0.25
2.84
Station/month
1
2
3
4
5
6
7
8
9
10
11
12
Sum
2023
Ha Noi
0.27
0.14
0.4
0.23
0.13
0.16
0.17
0.19
0.16
0.15
0.18
0.23
2.41
Hoa Binh
0.24
0.35
0.41
0.41
0.29
0.46
0.39
0.49
0.44
0.45
0.36
0.49
4.78
Ho Chi Minh
0.2
0.21
0.19
0.2
0.21
0.21
0.23
0.2
0.2
0.2
0.11
0.09
2.25
Can Tho
0.23
0.21
0.24
0.23
0.23
0.24
0.2
0.24
0.25
0.23
0.21
0.23
2.74
Yen Bai
0.23
0.29
0.25
0.25
0.21
0.22
0.27
0.34
0.39
0.45
0.28
0.27
3.45
Dry deposition of SO2 gas
Based on calculating equations of dry deposition to estimate SO2 dry deposition. High or low SO2 dry deposition depends significantly on wind speed, temperature, humidity, solar radiation, precipitation amount, and cloud cover factors.
Table 2 indicates that total national SO2 dry deposition in 5 years was 9.18 kg/ha/2019 year; 11.15 kg/ha/2020 year; 12.98 kg/ha/2021 year; 10.38 kg/ha/2022 year; and 11.06 kg/ha/2023 year. Thus, 2021 year has the highest SO2 dry deposition and 2019 year has the lowest SO2 dry deposition in 5 recent years. Furthermore, when considering SO2 dry deposition in each year shows that the Hanoi site has the highest SO2 dry deposition value from 2019 to the 2022 year as 2.22 kg/ha/year; 3.1 kg/ha/year; 4.04 kg/ha/year; and 2.66 kg/ha/year. However, in the 2023 year, Hanoi’s SO2 dry deposition is only 4th ranking while the Hoa Binh site has the highest SO2 dry deposition at 2.45 kg/ha/year in 2023. Moreover, the Hoa Binh site has an SO2 dry deposition value from 1.89 to 2.45 kg/ha/year in 5 years. Southern sites reveal a lower SO2 dry deposition amount than Northern sites, including the Ho Chi Minh site from 1.6 to 1.89 kg/ha/year with the highest SO2 dry deposition value in 2022. Can Tho site presented an SO2 dry deposition value from 1.86 to 2.34 kg/ha/year with the highest SO2 dry deposition amount in the 2023 year. Yen Bai site is a Northern area of Vietnam, which reveals SO2 dry deposition value from 1.99-2.96 kg/ha/year with the best SO2 dry deposition amount in the 2022 year. When considering medium SO2 concentration in 5 years, 2021 year has a high SO2 emitted concentration versus left years and the highest fluctuation amplitude in monthly.
Table 2: Dry deposition of SO2 gas at stations in Vietnam.
Ha Noi
0.14
0.16
0.18
0.28
0.2
0.2
0.18
0.22
0.21
0.18
0.13
0.14
2.22
Hoa Binh
0.1
0.1
0.16
0.15
0.13
0.07
0.07
0.14
0.06
0.05
0.06
0.09
1.18
Ho Chi Minh
0.18
0.15
0.13
0.13
0.15
0.21
0.17
0.14
0.16
0.12
0.1
0.11
1.76
Can Tho
0.15
0.15
0.17
0.12
0.17
0.13
0.16
0.22
0.12
0.12
0.17
0.18
1.86
Yen Bai
0.08
0.07
0.09
0.14
0.18
0.33
0.22
0.19
0.22
0.17
0.3
0.16
2.16
Station/month
1
2
3
4
5
6
7
8
9
10
11
12
Sum
2020
Ha Noi
0.24
0.22
0.3
0.27
0.35
0.27
0.19
0.37
0.23
0.26
0.18
0.23
3.1
Hoa Binh
0.16
0.16
0.2
0.16
0.2
0.16
0.19
0.26
0.24
0.22
0.22
0.17
2.34
Ho Chi Minh
0.09
0.1
0.08
0.09
0.16
0.18
0.17
0.2
0.18
0.15
0.08
0.11
1.6
Can Tho
0.09
0.17
0.17
0.14
0.16
0.19
0.2
0.22
0.16
0.15
0.24
0.22
2.11
Yen Bai
0.13
0.15
0.26
0.25
0.41
0.13
0.08
0.08
0.12
0.09
0.07
0.23
2
Station/month
1
2
3
4
5
6
7
8
9
10
11
12
Sum
2021
Ha Noi
0.56
0.4
0.44
0.68
0.35
0.23
0.28
0.25
0.25
0.21
0.22
0.16
4.04
Hoa Binh
0.19
0.28
0
0.21
0.16
0.24
0.24
0.22
0.27
0.26
0.15
0
2.23
Ho Chi Minh
0.1
0.15
0.18
0.16
0.19
0.21
0.17
0.17
0.19
0.15
0.11
0.06
1.82
Can Tho
0.09
0.17
0.16
0.15
0.16
0.14
0.19
0.15
0.18
0.18
0.17
0.18
1.93
Yen Bai
0.13
0.16
0.2
0.28
0.2
0.45
0.36
0.2
0.15
0.35
0.18
0.31
2.96
Station/month
1
2
3
4
5
6
7
8
9
10
11
12
Sum
2022
Ha Noi
0.18
0.22
0.22
0.18
0.18
0.36
0.23
0.25
0.19
0.22
0.22
0.2
2.66
Hoa Binh
0.12
0.17
0.18
0.17
0.12
0.26
0.18
0.23
0.16
0.14
0.15
0
1.89
Ho Chi Minh
0.18
0.19
0.14
0.17
0.19
0.17
0.18
0.18
0.15
0.17
0.11
0.08
1.89
Can Tho
0.09
0.11
0.18
0.17
0.21
0.16
0.16
0.17
0.19
0.14
0.17
0.2
1.95
Yen Bai
0.15
0.24
0.13
0.16
0.11
0.13
0.23
0.22
0.11
0.2
0.13
0.18
1.99
Station/month
1
2
3
4
5
6
7
8
9
10
11
12
Sum
2023
Ha Noi
0.21
0.11
0.3
0.14
0.11
0.18
0.19
0.09
0.15
0.17
0.14
0.24
2.04
Hoa Binh
0.15
0
0.25
0.25
0.18
0.28
0.24
0.3
0.27
0
0.22
0.3
2.45
Ho Chi Minh
0.19
0.15
0.15
0.17
0.16
0.16
0.17
0.16
0.17
0.17
0.09
0.07
1.82
Can Tho
0.21
0.21
0.2
0.18
0.2
0.19
0.17
0.2
0.2
0.18
0.18
0.23
2.34
Yen Bai
0.1
0.21
0.19
0.19
0.14
0.18
0.25
0.25
0.27
0.3
0.19
0.15
2.41
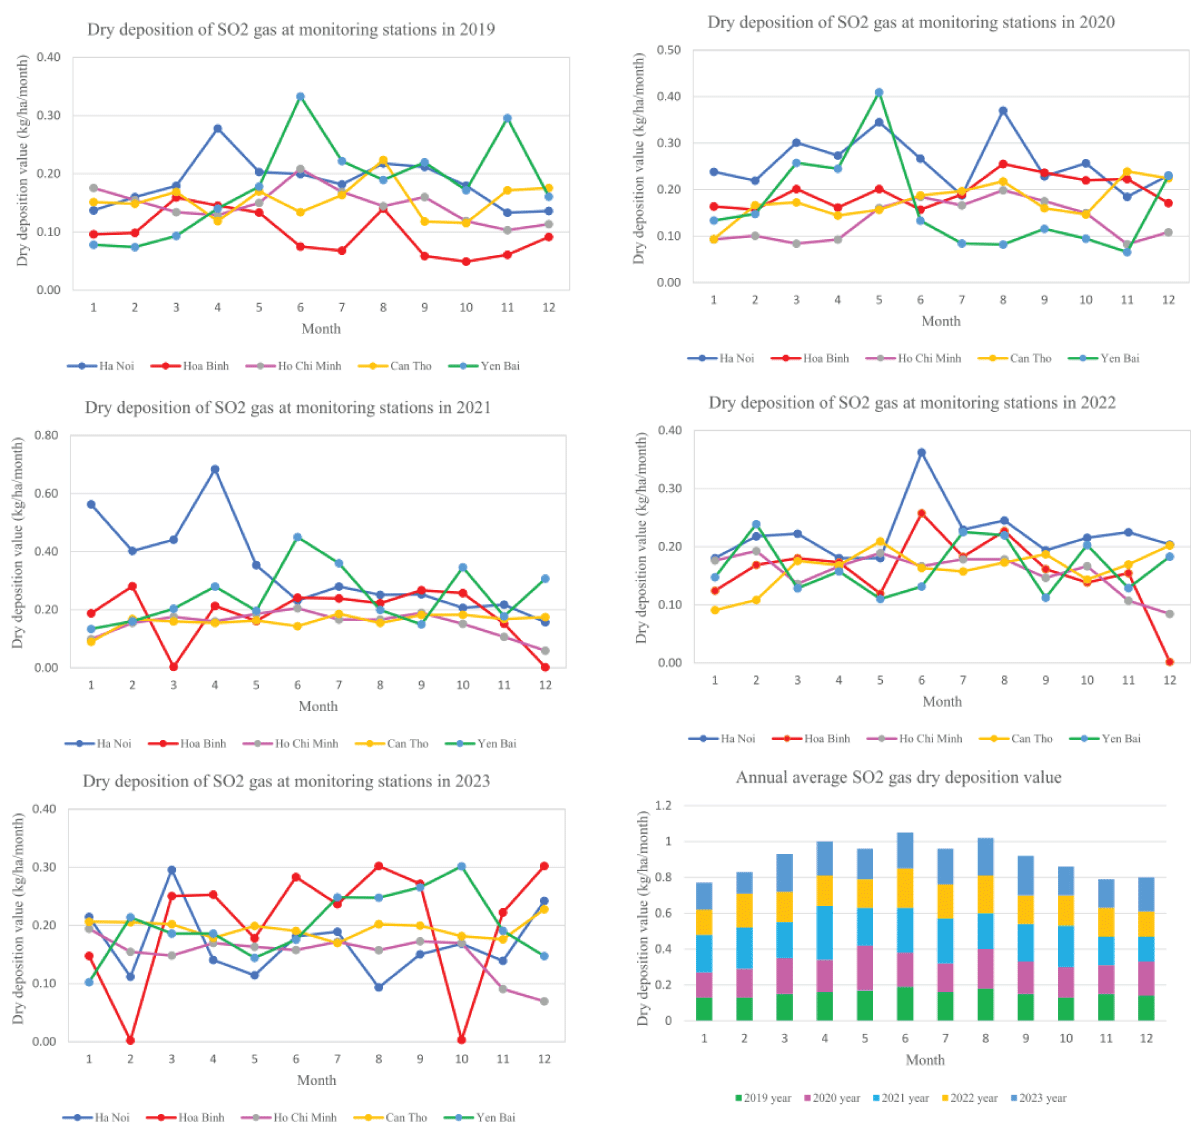
When considering SO2 dry deposition monthly, Figure 2 presents that the SO2 dry deposition value is changed from 0-0.75kg/ha/month, in which the best SO2 dry deposition value is in April at the Hanoi site. SO2 dry deposition amount changes monthly and in season.
Figure 2 reveals high SO2 dry deposition occurs normally in the summer and autumn (from April to August). Especially, April, May, and June have higher SO2 dry deposition than other months from 1999 to 2023 year, and it happens at Northern stations of Vietnam as Hanoi and Yen Bai sites. In contrast, the Southern sites have lower SO2 dry deposition amounts with not much change monthly as Can Tho and Ho Chi Minh sites. Besides, the Hoa Binh site indicates a big SO2 dry deposition change in 12 months, particularly in the 2023 year with SO2 dry deposition amount from 0-0.3 kg/ha/month, in which February and October have SO2 dry deposition amount near zero while summer months exist still at high value versus other sites in the same year. Generally, the Northern site has a higher SO2 dry deposition value than the left sites in 5 years. If considering medium SO2 dry deposition value with yearly presents 2021 year has a higher SO2 dry deposition amount than other years and the biggest fluctuation amplitude in 5 years.
Figure 2: Changing of SO2 gas dry deposition at stations in Vietnam.
The trend of SO2 in 5 years
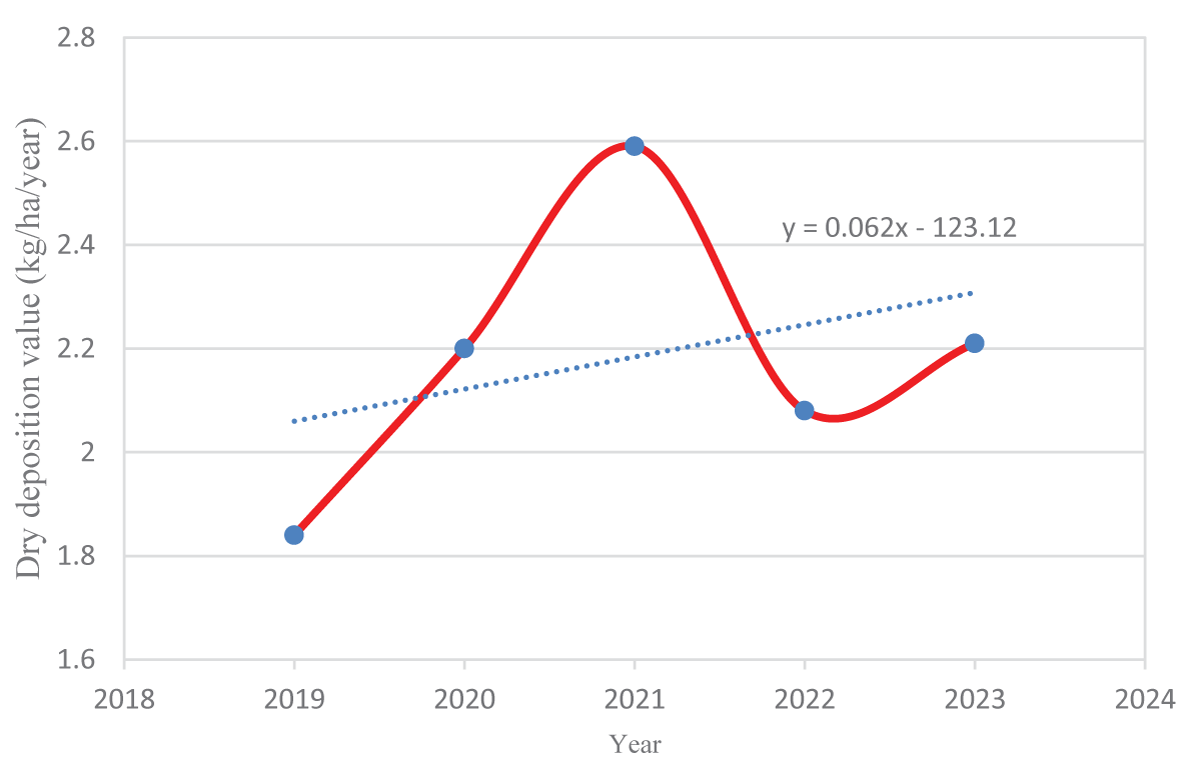
The figure below (Figure 3) shows the trend of SO2 gas dry deposition in 5 years, it indicates the increasing trend of SO2 dry deposition from 1999 to 2023 year. Especially, the sharp increase from 1999 to 2021, then its trend is lightly decreasing to the 2022 year and light growth to 2023 year. With increasing trend reveals that SO2 dry deposition will be light growth in future years at sites in Vietnam.
Figure 3: Trend of SO2 gas dry deposition in 1999-2023 year.
From determining SO2 emitted concentration via stations in Vietnam and estimating SO2 dry deposition amount in sites, this research has drawn some significance as SO2 emission at Northern sites is more changing than Southern ones in months being affected by meteorology and weather. Summer and autumn seasons have SO2 emitted concentrations higher than other seasons in 2019, 2020, and 2022 year at Yen Bai, Hoa Binh, and Ha Noi stations. The 2021 year has the highest SO2 dry deposition and the 2019 year has the lowest SO2 dry deposition in 5 recent years. The Hanoi site has the highest SO2 dry deposition value from 2019 to 2022 year. Hoa Binh site has the highest SO2 dry deposition at 2.45 kg/ha/year in 2023. High SO2 dry deposition occurs normally in the summer and autumn (from April to August). Southern sites have lower SO2 dry deposition amounts with not much change than the Northern sites of Vietnam. The increasing trend of SO2 dry deposition happened from 1999 to 2023 year and it increases sharply from 1999 to 2021. SO2 dry deposition will have a light increasing trend in the future.
Giardina, Buffa P. A new approach for modeling dry deposition velocity of particles. Journal of Atmospheric Environment. 2018; 180:11-22
Hardacre C, Mulcahy JP, Pope RJ, Jones CG, Rumbold ST, Li C, Johnson C, Turnock ST. Evaluation of SO2, SO 4 2-and an updated SO2 dry deposition parameterization in the United Kingdom Earth System Model.Journal of Atmosphere Chemistry and Physics. 2021; 21: 18465-18497
Gao Q, Zhang X, Liu L, Lu X, Wang Y. A database of atmospheric inorganic nitrogen deposition fluxes in China from satellite monitoring. Journal of Scientific Data. 2023; 10: 698 https://doi.org/10.1038/s41597-023-02607-z
Zhou K, Zhao Y, Zhang L, Xi M. Declining dry deposition of NO2 and SO2 with diverse spatiotemporal patterns in China from 2013 to 2018. Journal of Atmospheric Environment.2021; 262: 118655.
EANET (Acid Deposition Monitoring Network in East Asia). Technical Manual for Air Concentration Monitoring in East Asia.2013; 84-114. http://www.eanet.asia/product/manual/techacm.pdf.
Ban S, Matsuda K, Sato K, Ohizumi T. Long-term assessment of nitrogen deposition at remote EANET sites in Japan. Journal of Atmospheric Environment.2016; 146: 70-78
Wesely ML, Hicks BB. A review of the current status of knowledge on dry deposition. Journal of Atmospheric Environment.2000; 34:2261-2282
EANET (Acid Deposition Monitoring Network in East Asia). Technical Manual on Dry Deposition Flux Estimation in East Asia.2010; 23-26. http://www.eanet.asia/product/manual/techdry.pdf.
Parameterizations of surface resistances to gaseous dry deposition in regional scale numerical models. Journal of Atmospheric Environment.1989; 23: 1293-1304
Walcek CJ. A theoretical estimate of O3 and H2O2 dry deposition over the northeast United States. Atmospheric Environment.1987; 21: 1649-1659
Matsuda K. Estimation of dry deposition for sulfur and nitrogen compounds in the atmosphere: updated parameterization of deposition velocity. Journal of Japan Society of Atmospheric Environment.2008; 43. 332-339.
Erisman JW, Draaijers GPJ. A Studies in Environmental Science 63, Atmospheric Deposition in Relation to Acidification and Eutrophication, studies in environmental science, Elsevier.1995; 63: 55-75
Erisman JW. Evaluation of a surface resistance parameterization of sulfur dioxide. Atmospheric Environment. 1994; 28: 2583-2594.
Nguyen MI, Trend of SO2 Gas Dry Deposition in Vietnam. IgMin Res. Aug 26, 2024; 2(8): 734-738. IgMin ID: igmin240; DOI:10.61927/igmin240; Available at: igmin.link/p240
Address Correspondence: Minh Thu Nguyen, Vietnam Institute of Meteorology, Hydrology and Climate Change, Ministry of Natural Resources and Environment, Vietnam, Email: [email protected]
How to cite this article: Nguyen MI, Trend of SO2 Gas Dry Deposition in Vietnam. IgMin Res. Aug 26, 2024; 2(8): 734-738. IgMin ID: igmin240; DOI:10.61927/igmin240; Available at: igmin.link/p240
Figure 1: Changing of SO2 concentration at stations in Vietn...
Figure 2: Changing of SO2 gas dry deposition at stations in ...
Figure 3: Trend of SO2 gas dry deposition in 1999-2023 yea...
Giardina, Buffa P. A new approach for modeling dry deposition velocity of particles. Journal of Atmospheric Environment. 2018; 180:11-22
Hardacre C, Mulcahy JP, Pope RJ, Jones CG, Rumbold ST, Li C, Johnson C, Turnock ST. Evaluation of SO2, SO 4 2-and an updated SO2 dry deposition parameterization in the United Kingdom Earth System Model.Journal of Atmosphere Chemistry and Physics. 2021; 21: 18465-18497
Gao Q, Zhang X, Liu L, Lu X, Wang Y. A database of atmospheric inorganic nitrogen deposition fluxes in China from satellite monitoring. Journal of Scientific Data. 2023; 10: 698 https://doi.org/10.1038/s41597-023-02607-z
Zhou K, Zhao Y, Zhang L, Xi M. Declining dry deposition of NO2 and SO2 with diverse spatiotemporal patterns in China from 2013 to 2018. Journal of Atmospheric Environment.2021; 262: 118655.
EANET (Acid Deposition Monitoring Network in East Asia). Technical Manual for Air Concentration Monitoring in East Asia.2013; 84-114. http://www.eanet.asia/product/manual/techacm.pdf.
Ban S, Matsuda K, Sato K, Ohizumi T. Long-term assessment of nitrogen deposition at remote EANET sites in Japan. Journal of Atmospheric Environment.2016; 146: 70-78
Wesely ML, Hicks BB. A review of the current status of knowledge on dry deposition. Journal of Atmospheric Environment.2000; 34:2261-2282
EANET (Acid Deposition Monitoring Network in East Asia). Technical Manual on Dry Deposition Flux Estimation in East Asia.2010; 23-26. http://www.eanet.asia/product/manual/techdry.pdf.
Parameterizations of surface resistances to gaseous dry deposition in regional scale numerical models. Journal of Atmospheric Environment.1989; 23: 1293-1304
Walcek CJ. A theoretical estimate of O3 and H2O2 dry deposition over the northeast United States. Atmospheric Environment.1987; 21: 1649-1659
Matsuda K. Estimation of dry deposition for sulfur and nitrogen compounds in the atmosphere: updated parameterization of deposition velocity. Journal of Japan Society of Atmospheric Environment.2008; 43. 332-339.
Erisman JW, Draaijers GPJ. A Studies in Environmental Science 63, Atmospheric Deposition in Relation to Acidification and Eutrophication, studies in environmental science, Elsevier.1995; 63: 55-75
Erisman JW. Evaluation of a surface resistance parameterization of sulfur dioxide. Atmospheric Environment. 1994; 28: 2583-2594.






 Scan and get link