IGMIN: We're glad you're here. Please click 'create a new query' if you are a new visitor to our website and need further information from us.
If you are already a member of our network and need to keep track of any developments regarding a question you have already submitted, click 'take me to my Query.'
Welcome to IgMin Research – an Open Access journal uniting Biology, Medicine, and Engineering. We’re dedicated to advancing global knowledge and fostering collaboration across scientific fields.
At IgMin Research, we bridge the frontiers of Biology, Medicine, and Engineering to foster interdisciplinary innovation. Our expanded scope now embraces a wide spectrum of scientific disciplines, empowering global researchers to explore, contribute, and collaborate through open access.
Welcome to IgMin, a leading platform dedicated to enhancing knowledge dissemination and professional growth across multiple fields of science, technology, and the humanities. We believe in the power of open access, collaboration, and innovation. Our goal is to provide individuals and organizations with the tools they need to succeed in the global knowledge economy.
IgMin Publications Inc., Suite 102, West Hartford, CT - 06110, USA
It is widely believed that emission of greenhouse gases, particularly CO2, is warming the world, and the consequences of this are serious. The world is heavily engaged in reducing emissions of CO2. The global effort to reduce emissions involves investment of very large sums, yet the proper scientific explanation of how CO2 warms the Earth is not widely understood. The objective of this research is to provide a clear, understandable description and quantitative model of the physics whereby increased CO2 produces global warming.
The Sun continuously inputs power at 341 W/m2 to the Earth, and the Earth radiates power to space. The difference between the two determines whether the Earth warms or cools to maintain a power balance. The approach taken here is to estimate the effect of rising CO2 on the ability of the Earth to radiate power to space.
The methodology involves dividing the Earth’s atmosphere into 150 100-m layers and modeling CO2 irradiance (12-17-micron wavelength band) through these layers. Each layer radiates in the IR according to the Stefan-Boltzmann law at its temperature. As the CO2 concentration increases, the range of primary emitting layers increases in altitude, where it is on average cooler, reducing outward radiation from the Earth in the 12-17-micron wavelength band. The Earth must warm to compensate.
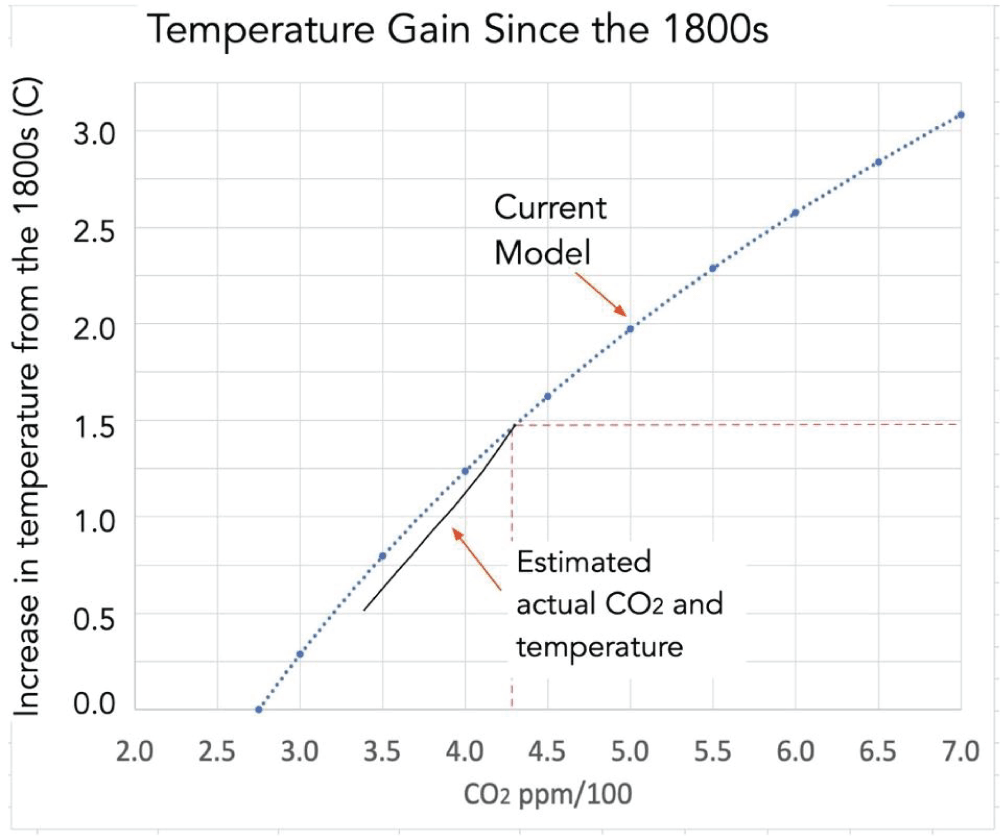
The forcing in the year 2025 was related to the known temperature increase from the 1800s and thus converted the calculated curve of radiative forcing vs. CO2 concentration to a curve of temperature gain from the 1800s vs. CO2 concentration. This plot is of fundamental importance in predicting future climate change and devising policies for mitigation. It indicates that we are likely to reach a temperature increase from the 1800s of 2.0 °C if CO2 reaches about 500 ppm, and 3.0 °C if CO2 reaches about 680 ppm.
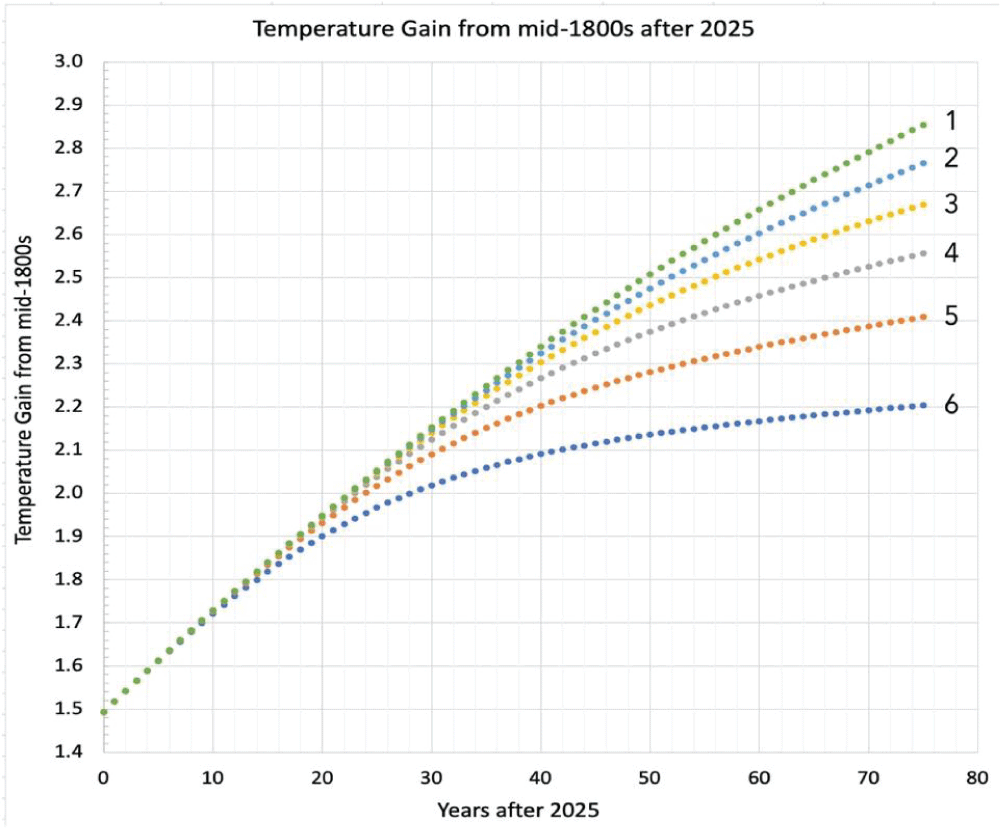
Six hypothetical scenarios were created for further CO2 emissions in the 21st century, and future temperatures for each scenario were estimated. The results span a range from 2.2 °C to 2.9 °C for the temperature increase from the 1800s to the year 2100, depending on the emission scenario.
It is widely believed that emission of greenhouse gases, particularly CO2, is warming the world, and the consequences of this are serious. The world is heavily engaged in reducing emissions of CO2 by greater use of non-emitting energy sources, increased energy efficiency, and phasing out high-emitting fuels. The global effort to reduce emissions involves investment of very large sums, yet the proper scientific explanation of how CO2 warms the Earth is not widely understood. The prominent institutions such as NOAA, NSF, NASA, Smithsonian, … typically describe a “thermal blanket” that obstructs outward propagation of IR radiation from the Earth, and adding CO2 to the atmosphere thickens the “blanket,” inhibiting energy loss from the Earth, causing the Earth to warm. This would be a proper description for a hypothetical Earth with no CO2 in the atmosphere, and as you add CO2 to that hypothetical atmosphere, the thermal blanket gets thicker and the Earth warms [11van Wijngaarden WA, Happer W. Dependence of Earth’s thermal radiation on five most abundant greenhouse gases. arXiv [physics.ao-ph]. 2020. doi:10.48550/arXiv.2006.03098,22Zhong W, Haigh JD. The greenhouse effect and carbon dioxide. Weather. 2013;68(4):100-105. doi:10.1002/wea.2072]. But having reached the current point where the CO2 concentration is 425 ppm, the thermal blanket is now so thick that adding more CO2 to the atmosphere hardly changes it. This led some misguided investigators to conclude that rising CO2 does not produce warming [33Henry B. Scientific proof that CO2 does NOT cause global warming. World J Adv Res Rev. 2024;21(3):1688-1690. doi:10.30574/wjarr.2024.21.3.0884]. The problem is that the physical mechanism by which increased CO2 warms the Earth changes when the CO2 concentration is as high as it is today (~ 425 ppm), and a different description and scientific approach is called for.
One of the most important challenges to mankind is understanding how its future use of fossil fuels is likely to affect the future climate, and how that might affect commerce and society. An important part of that bigger picture is relating the increase in global average temperature since the 1800s to the current CO2 concentration in the atmosphere. Typically, complex climate models are used to estimate the relationship between temperature and CO2 concentration [44Intergovernmental Panel on Climate Change (IPCC). Sixth Assessment Report. 2023. Available from: https://www.ipcc.ch/assessment-report/ar6/,55Myhre G, Highwood EJ, Shine KP, Stordal F. New estimates of radiative forcing due to well-mixed greenhouse gases. Phys Rev Lett. 1998;80:2715-2718.]. However, such models are like a black box that is difficult to peer into, to understand the specific physics of how increased CO2 warms the Earth.
It is important to provide a lucid model that is transparent for the physical mechanism whereby increased CO2 concentration in the atmosphere produces global warming. Although previous work pointed the way toward understanding that the actual effect of increased CO2 is to elevate the altitude at which CO2 in the atmosphere radiates to space (where it is cooler), no simple, clear, quantitative analysis seems to be available [22Zhong W, Haigh JD. The greenhouse effect and carbon dioxide. Weather. 2013;68(4):100-105. doi:10.1002/wea.2072,6-106-10Dufresne J, Eymet V, Crevoisier C, Grandpeix JY. Greenhouse effect: the relative contributions of emission height and total absorption. J Climate. 2020;33:3827-3844. doi:10.1175/JCLI-D-19-0193.1]. The average solar power input to Earth is 341 W/m2 [1111Lindsey R. Climate and Earth’s Energy Budget. NASA Earth Observatory. 2009. Available from: https://earthobservatory.nasa.gov/features/EnergyBalance-1414Stephens G, Li J, Wild M, et al. An update on Earth’s energy balance in light of the latest global observations. Nature Geosci. 2012;5:691–696. doi:10.1038/ngeo1580]. If the Earth radiates an equal amount of power as IR radiation, it will remain in a steady state. Part of the spectrum of IR radiation emitted by the Earth is the 15-17-micron CO2 band. To the extent that increased CO2 reduces radiation in the 15-17-micron CO2 band from the Earth to space, the Earth will warm to compensate and reestablish a steady state at a higher temperature.
In 2024, I published a paper that explains simply and qualitatively the physical mechanism by which adding CO2 to the present atmosphere warms the Earth [1515Rapp D. How increased CO2 warms the Earth: two contexts for the greenhouse gas effect. IgMin Res. 2024 Oct 24;2(10):854–859. IgMin ID: igmin259. doi:10.61927/igmin259. Available from: https://igmin.link/p259]. In that article, I pointed out that the common narrative is that there is a “thermal blanket” that resists outward IR radiation, and adding CO2 to the atmosphere thickens the blanket, producing warming. I showed that the thermal blanket idea would be appropriate for a hypothetical Earth with no CO2 in the atmosphere and would describe the effect of initially adding CO2 in moderate amounts [1515Rapp D. How increased CO2 warms the Earth: two contexts for the greenhouse gas effect. IgMin Res. 2024 Oct 24;2(10):854–859. IgMin ID: igmin259. doi:10.61927/igmin259. Available from: https://igmin.link/p259]. But when the atmosphere already contains more than 300 ppm CO2, the thermal blanket is so effective that adding small amounts of CO2 hardly changes the thermal blanket, and warming derives from a totally different mechanism. The widely disseminated “thermal blanket” narrative does not properly describe the warming effect of rising CO2 with the CO2 concentration at present levels. Adding CO2 to the atmosphere raises the average altitude in the atmosphere where IR is radiated to space, and since it is cooler there on average, the Earth cannot radiate as much power when CO2 increases, and the Earth warms to reestablish thermal equilibrium. There is great interest in this topic, as evidenced by the fact that my published article was viewed 35,000 times and downloaded 540 times. However, my paper was qualitative and descriptive, and it did not provide quantitative details of the radiant transfer process in the atmosphere.
Recently, I accidentally came across a series of postings on a blog by Dr. Clive Best that provides very important data and understanding that should have been included in my paper, had I known it existed. I thought I had done an adequate search, but because search engines prioritize blog postings very low in their responses to queries, I missed this important work. Not all important science is recorded in the peer-reviewed literature.
This paper is an Addendum to my previous paper, incorporating my attempt to interpret Best’s important work. It provides a clear, understandable, quantitative description and calculation of how increased CO2 warms the Earth – a necessary and critical need for a world so heavily invested in mitigating climate change.
The Sun continuously inputs power at 341 W/m2 to the Earth, and the Earth radiates power to space. The difference between the two determines whether the Earth warms or cools to maintain a power balance. We can estimate the power input from the Sun reasonably well, but estimation of the rate of energy loss is far more difficult.
One approach is to model the upward flow of IR from the Earth’s surface through the atmosphere. Although the equations become complex, the model can be understood in simple terms. Evaporation and convection drive power upward in the lower atmosphere. At higher altitudes, water is frozen out, and the density is low enough that energy is transmitted preferentially by IR radiation. There is a continual flow of IR radiation up and down, with a net flux upward. This is due to the fact that the temperature decreases with increasing altitude, and emission is thereby reduced with increasing altitude, while absorption depends on the absorptivity and the intensity of the incident radiation. If you think of the atmosphere as a series of layers, and each higher layer decreases in temperature, then each layer will radiate more power to the layer above it than it receives from the layer above it.
The IR radiation in the 13-17-micron band is particularly important and is controlled by the CO2 concentration in the atmosphere. Although the Earth radiates energy in other wavelengths, the effect of increasing CO2 can be estimated by concentrating on the 13-17-micron band.
The appropriate way to consider the effect of increasing CO2 is to consider the emission of IR radiation from the atmosphere. Here we use the term “IR” as shorthand to mean the IR in the 13-17-micron band where CO2 absorbs. Carbon dioxide molecules emit and absorb IR radiation to one another in the atmosphere, flooding the atmosphere with IR. As the atmospheric density decreases with increasing altitude, an altitude is reached where the CO2 concentration is too low to maintain this IR exchange, and this might be thought of as the top of the atmosphere for the IR. More specifically, when the density is low enough that about half of the IR passes through a 100-m thick volume, we can consider that as roughly the IR-effective top of the atmosphere.
Because the density and temperature of the atmosphere decrease with altitude, there is a bias, and more IR is transmitted outward than inward at all altitudes. If one can imagine the atmosphere divided into many horizontal layers, a fraction of the IR from each layer escapes the Earth and contributes to the cooling of the Earth. The higher the altitude of each layer, the greater is the fraction of IR radiation that can escape. IR radiation from the Earth occurs preferentially at higher altitudes. The total radiation emitted by the Earth to space is the sum of contributions from all the layers, each layer emitting according to its local temperature. As more CO2 is added to the atmosphere, the layers that contribute to outward emission increase in altitude where it is cooler, and since emission of radiation is less efficient at lower temperatures, the Earth is less efficient at radiating to space, and the Earth warms to compensate.
In a previous paper, I outlined this description of how the Earth warms when CO2 is added to the atmosphere already containing a significant amount of CO2 [1515Rapp D. How increased CO2 warms the Earth: two contexts for the greenhouse gas effect. IgMin Res. 2024 Oct 24;2(10):854–859. IgMin ID: igmin259. doi:10.61927/igmin259. Available from: https://igmin.link/p259]. Since then, I discovered the unpublished work of Clive Best that quantitatively models this process, providing much greater detail and new insights into how the Earth warms when CO2 is added to the atmosphere already containing a significant amount of CO2. Unfortunately, that analysis is buried in a Blog which is difficult to find and is probably widely ignored by the climate science community. Yet, this analysis is probably the best and most important existing analysis of how adding CO2 to the atmosphere warms the Earth – a very important work. In this
Clive Best’s model of the greenhouse effect
In a series of papers, Clive Best explained, described, and clarified the effect of adding CO2 to the atmosphere already containing a significant amount of CO2 (300+ ppm); how it reduces radiant power emitted from the Earth to space, producing global warming [1616Best C. A collection of posts regarding the CO2 greenhouse effect and AGW. Available from: https://clivebest.com/blog/?page_id=6048]. In this paper, I provide my best efforts to interpret Best’s important work.
In an early paper, Best described the basic model [1616Best C. A collection of posts regarding the CO2 greenhouse effect and AGW. Available from: https://clivebest.com/blog/?page_id=6048]. Only the 13-17-micron band of CO2 was considered. The atmosphere is assumed to be dry with no other greenhouse gas present.
It was assumed that the surface of the Earth radiates as a blackbody temperature of 288K. The atmosphere is divided into 150 layers, each 100 m thick. Each layer absorbs photons from any direction according to its local temperature and the density of CO2 at that level. In the initial model, he started at the bottom and worked his way up. At each level, the transmitted and absorbed IR from below were calculated. The actual net IR flux upwards is the difference between the up-going radiation and the integral of all the higher levels of down-going radiation. Thermal equilibrium is assumed for each level. The IR fluxes up and down were then stored for each level. As Best explained:
“The way to think about it is that radiation from the sun heats the surface (modulated by clouds). The surface then cools by IR radiation (Stefan-Boltzmann). S-B frequencies coinciding with CO2 and H2O resonant frequencies are absorbed by greenhouse gases and re-emitted up through the atmosphere to where the atmosphere is thin enough for those photons to escape to space. As a result, the surface loses heat faster through convection of warm surface air upwards to a height where the air is thin enough for all radiation to escape to space. This defines the tropopause where convection stops.”
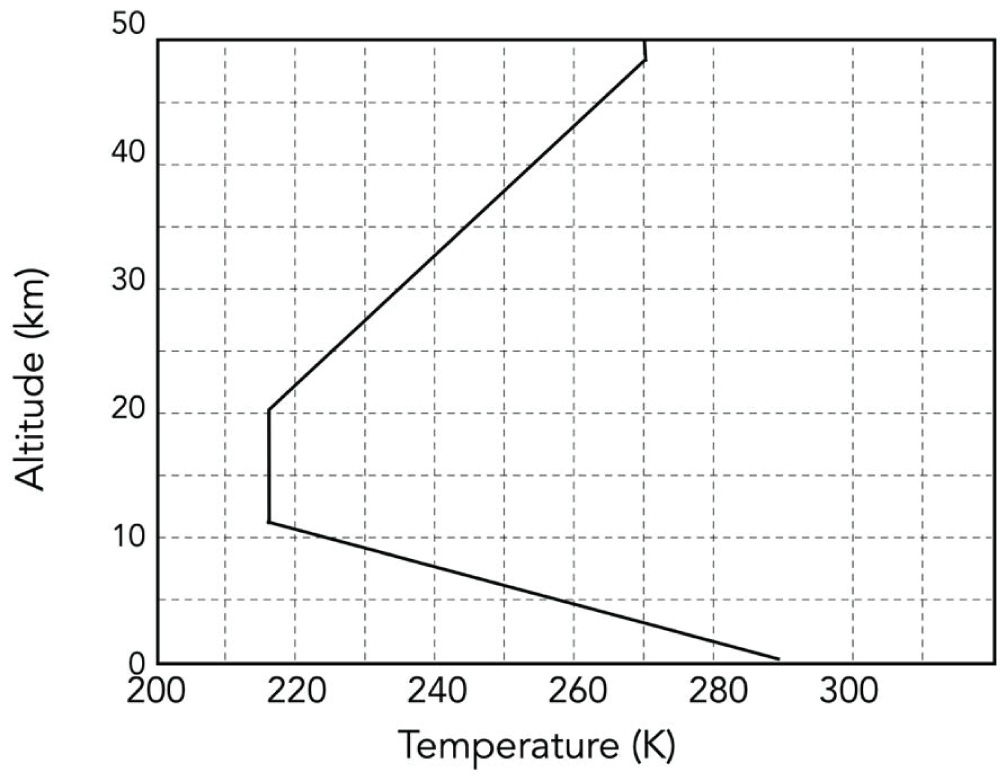
He provided a model for the temperature as a function of altitude (Figure 1) [1717Best C. A simple model of the CO2 greenhouse effect. 2012 Nov 2. Available from: https://clivebest.com/blog/?p=4265].
1818Best C. The CO2 GHE demystified. 2013 Feb 23. Available from: https://clivebest.com/blog/?p=4597]." /> Figure 1: Model for temperature vs. altitude in the atmosphere [1818Best C. The CO2 GHE demystified. 2013 Feb 23. Available from: https://clivebest.com/blog/?p=4597].
The net total radiant power emitted by the Earth is a sum of all contributions from the 150 layers of atmosphere, each at its own temperature according to Figure 1. For layers below 10 km, the temperature decreases with increasing altitude. For layers at altitudes between 10 km and 15 km, the temperature is independent of altitude.
The key to the calculation is this: Best summed up all the outgoing radiant power from all the layers at CO2 = 300 ppm. He also did the same for CO2 = 600 ppm. At 600 ppm, more of the radiant emission takes place in higher layers where more of the layers are cooler, so the net radiant power is less, and the deficit in the Earth’s energy balance requires that the surface must shift to warmer temperatures.
In a later publication, Best changed the model, and instead of starting at the Earth’s surface, he started at the top layer and worked his way down [1818Best C. The CO2 GHE demystified. 2013 Feb 23. Available from: https://clivebest.com/blog/?p=4597]. Best explained:
“IR radiation originating from space is tracked downwards to Earth to derive for each wavelength the height at which more than half of it gets absorbed within a 100-meter layer. This identifies the height where the atmosphere becomes opaque at a given wavelength. This also coincides with the effective emission height for IR radiation to escape from the atmosphere to space. A program was written using a standard atmospheric model to perform a line-by-line calculation for CO2 with data from the HITRAN spectroscopy database. The result for CO2 showed that outgoing radiant power from the central peak of the 13-17-micron band originates from high in the stratosphere, where it is comparatively warmer. It is mostly the lines at the edges of the band that lie in the troposphere, where it is cooler. The calculation then reveals how changes in CO2 concentration affect the emission height and thereby reduce net outgoing radiant power as the CO2 concentration is increased. This demonstrates how the greenhouse effect on Earth is determined by greenhouse gases in the upper atmosphere and not [via a thermal blanket] at the surface” [1818Best C. The CO2 GHE demystified. 2013 Feb 23. Available from: https://clivebest.com/blog/?p=4597].
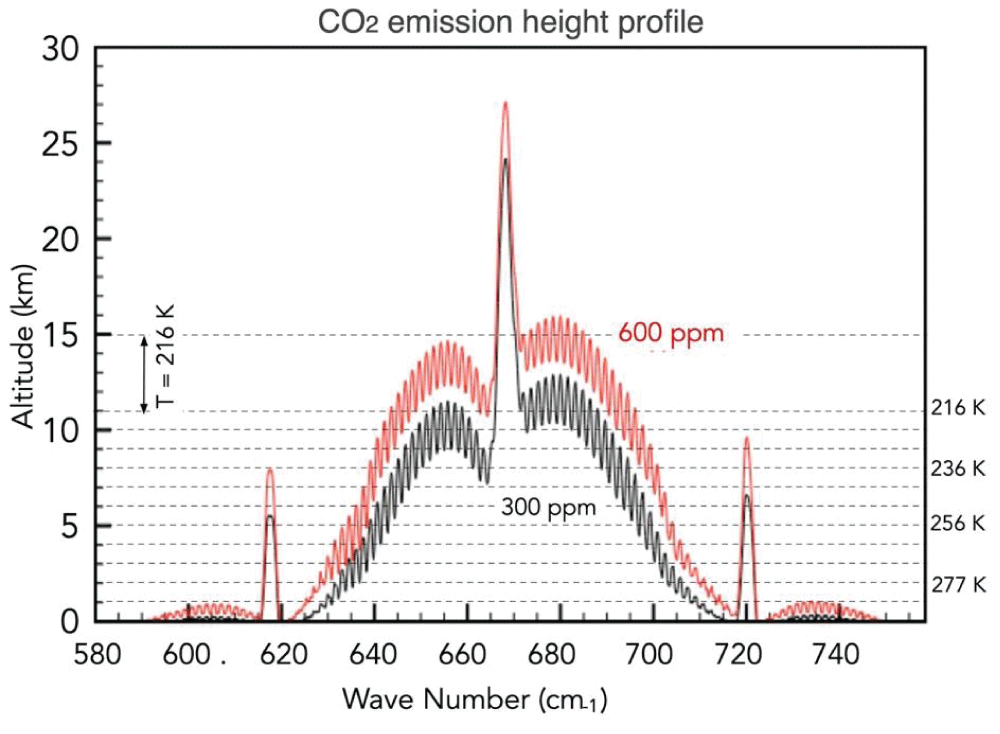
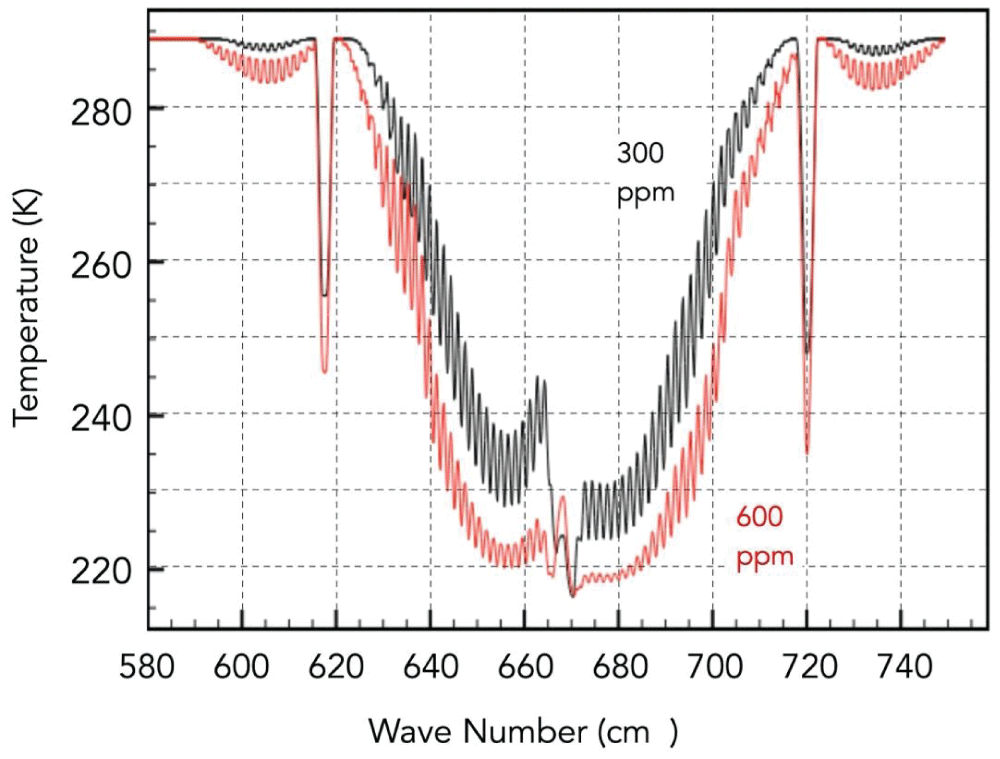
Best illustrated the difference between CO2 = 300 ppm and CO2 = 600 ppm by plotting the emission height (the altitude where 50% of the entering IR passes through a 100-m layer) vs. wavelength within the 13-17-micron CO2 band vs. wavelength. Essentially, all the emission at any wavelength comes from below the emission height. At any wavelength where the emission height for 300 ppm occurs at temperatures warmer than 216 K, the corresponding emission height at 600 ppm will occur at a lower temperature (Figure 2). At CO2 = 300 ppm, for most wavelengths, the range of effective temperatures is higher than for CO2 = 600 ppm, so when CO2 increases from 300 ppm to 600 ppm, the layers that radiate to space are cooler on average, reducing the outflow of radiant power at 600 ppm compared to 300 ppm (Figure 3). The temperatures shown in Figure 3 allow calculation of the radiant power emitted at the emission height for each CO2 concentration.
1818Best C. The CO2 GHE demystified. 2013 Feb 23. Available from: https://clivebest.com/blog/?p=4597]." /> Figure 2: CO2 emission height profiles for CO2 = 300 ppm and for CO2 = 600 ppm, smoothed with a resolution of 20 lines [1818Best C. The CO2 GHE demystified. 2013 Feb 23. Available from: https://clivebest.com/blog/?p=4597].
1818Best C. The CO2 GHE demystified. 2013 Feb 23. Available from: https://clivebest.com/blog/?p=4597]." /> Figure 3: The temperature at CO2 emission heights for CO2 = 300 ppm and for CO2 = 600 ppm [1818Best C. The CO2 GHE demystified. 2013 Feb 23. Available from: https://clivebest.com/blog/?p=4597].
This model explains the mechanism of how increasing the CO2 concentration reduces outgoing radiant power from the present atmosphere, thereby creating an energy imbalance, causing the Earth to warm.
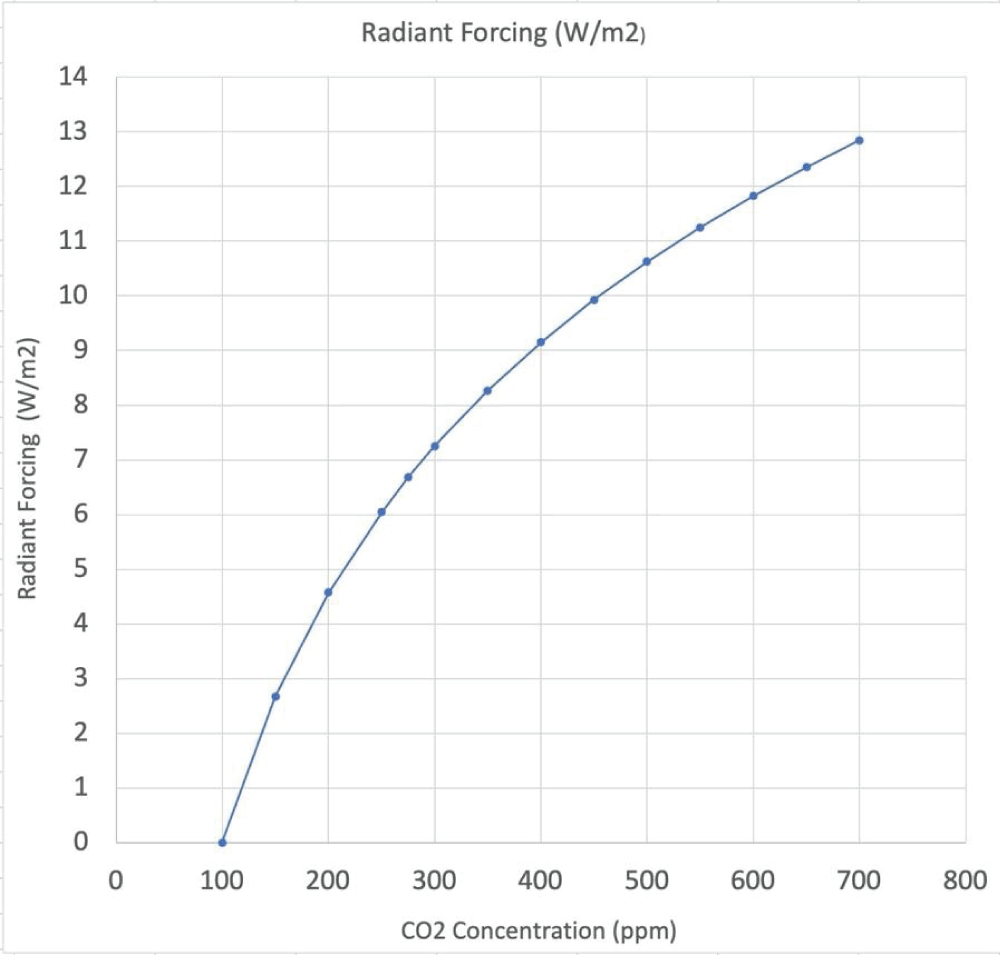
Now that Best had the atmosphere divided into 150 100-m layers with an estimated temperature for each layer, he applied the Planck radiation law to determine the radiant power emitted at each wavelength in the 15-17-micron wavelength band at each CO2 concentration. Summing up from all the layers, he estimated the total radiant emission in the 15-17-micron wavelength band at each concentration of CO2. Choosing the radiant emission at 100 ppm as a baseline, we plot the radiant forcing defined as radiant emission at any ppm minus radiant emission at 100 ppm in Figure 4. Clive Best also compared his result to a published paper that utilized a complex atmospheric model to estimate the radiative forcing and found good agreement [77Miskolczi F. Greenhouse gas theories and observed radiative properties of the Earth’s atmosphere. 2023. Available from: https://www.researchgate.net/publication/374530216].
1919Best C. Radiative forcing of CO2. 2013 Feb 27. Available from: https://clivebest.com/blog/?p=4698]." /> Figure 4: Radiant forcing = radiant emission at any ppm minus radiant emission at 100 ppm. This curve is well fitted by the equation RF = 6.6 LN (ppm/100) [1919Best C. Radiative forcing of CO2. 2013 Feb 27. Available from: https://clivebest.com/blog/?p=4698].
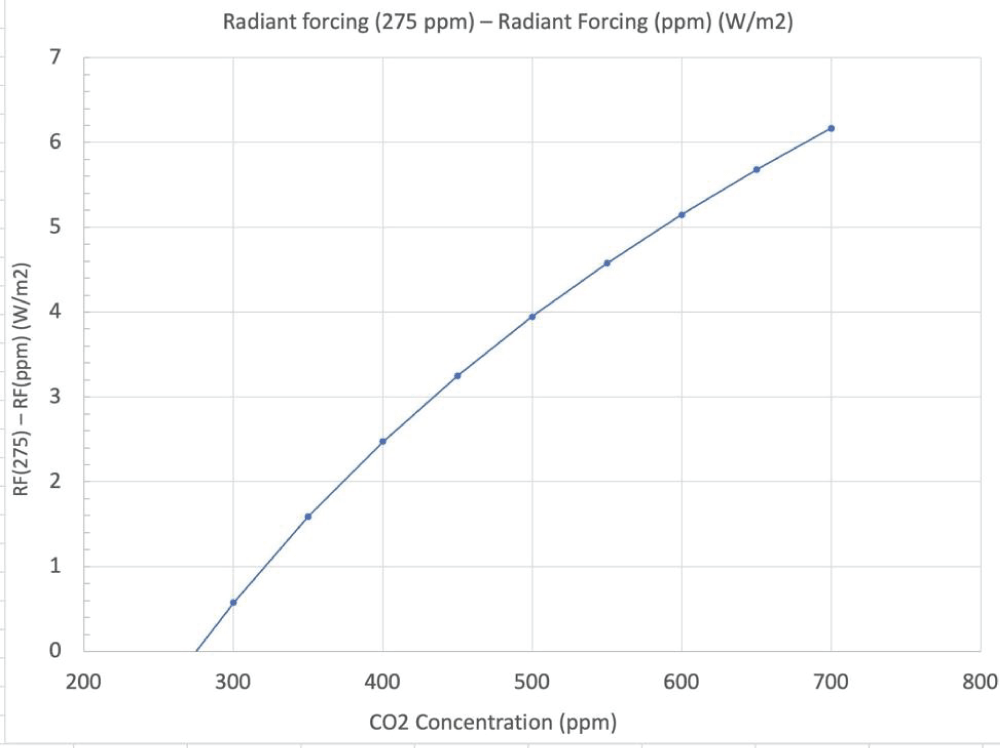
While Best used 100 ppm as a baseline, it is more convenient to use 275 ppm as a baseline because that corresponds to the mid-1800s. If we select the outgoing radiant emission at 275 ppm (corresponding to the mid-1800s) as a baseline, then subtracting the total radiant emission at any CO2 concentration from the total radiant emission at 275 ppm yields the deficit in total radiant emission at any CO2 concentration compared to that in the 1800s. Best’s model produces the plot shown in Figure 5. Since Best’s model maintains the Earth's surface temperature at 288 K, the difference between radiant emission (RE) at 275 ppm and any higher ppm represents what is commonly called the “radiant forcing” that would drive the Earth’s temperature higher. The increase in radiant forcing per unit increase in CO2 concentration decreases at increasing CO2 concentrations.
Figure 5: The difference between radiant emission in the 15-17-micron band between CO2 at 275 ppm and any other ppm – otherwise known as the “radiant forcing” at any ppm. This curve is well fitted by the equation RF = 6.6 LN(ppm/100) – 6.6 LN(275/100).
According to this model, the radiant forcing already reached about 3 W/m2 in 2025, which is about half of the radiant forcing at 700 ppm.
In review, Best’s model involves these steps:
Divide the atmosphere into 150 100-m thick layers, each layer at the temperature shown in Figure 1 for its altitude.
For any particular concentration of CO2 (ppm), calculate the outgoing IR radiant emission from each layer.
Sum over all layers to obtain the outgoing IR radiant emission from the atmosphere at any particular concentration of CO2 (ppm).
Take the difference between the outgoing IR radiant emission from the atmosphere at 275 ppm (characteristic of the 1800s) and any other CO2 concentration (ppm) to get the net radiant forcing at that ppm.
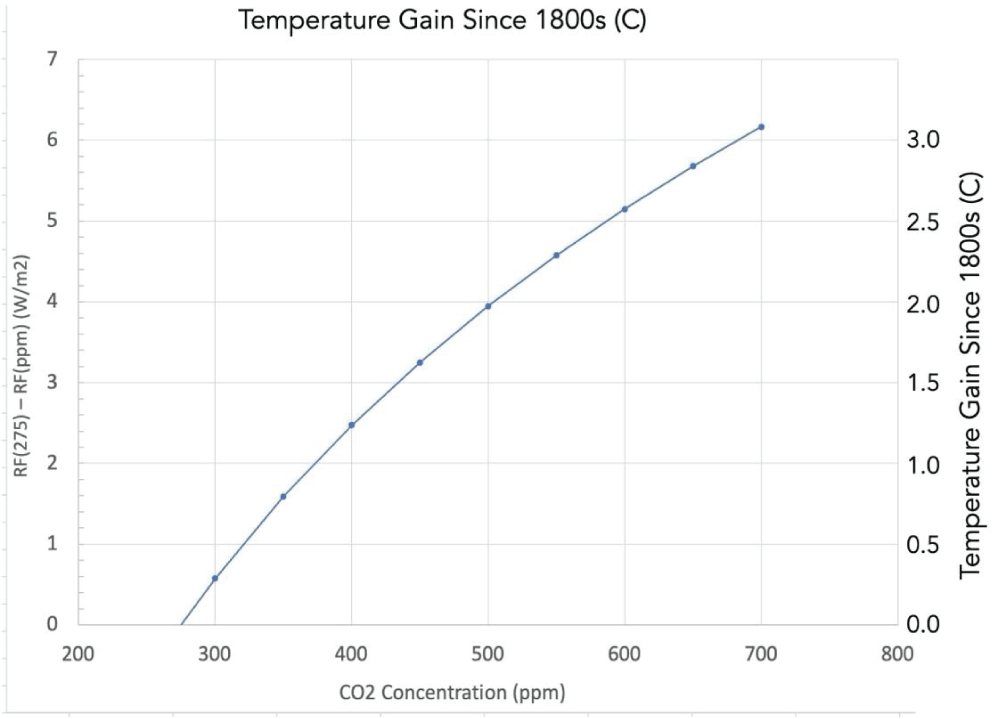
Best used the radiative forcing data to estimate how much the Earth would warm for any increase in CO2 concentration [1919Best C. Radiative forcing of CO2. 2013 Feb 27. Available from: https://clivebest.com/blog/?p=4698]. That required assumptions about clouds, emissivity, and blackbody radiation. Here, we take a more pragmatic approach. In 2025, the CO2 concentration was about 425 ppm, where the radiative forcing was about 2.9 W/m2, and the temperature gain from the 1800s was about 1.5 °C. We might therefore assume that each W/m2 of radiant forcing produces a temperature rise from the 1800s of (1.5/2.9) = 0.52 °C. We can then convert Figure 5 to a temperature plot as shown in Figure 6.
Figure 6: Estimate of temperature gain since the 1800s vs. ppm CO2. Note that the temperature gain at 425 ppm was 1.5 °C in the year 2025. This curve is well fitted by the equation: T = 3.43 LN(ppm/100) – 3.43 LN(275/100) = 3.43 LN(ppm/275).
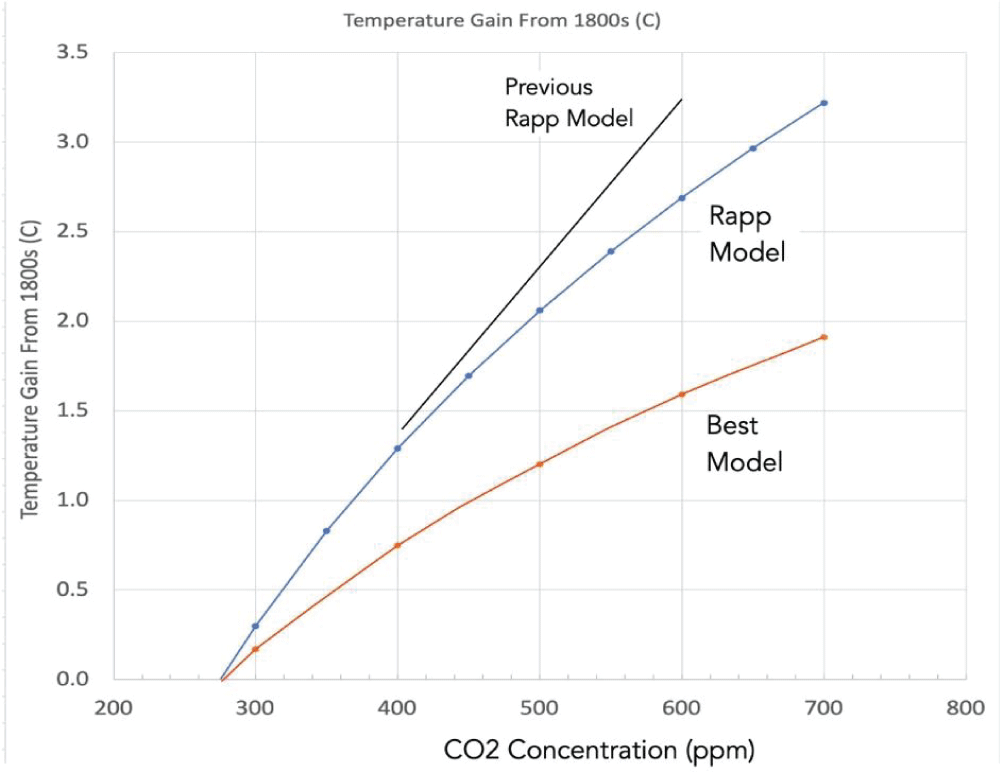
In a previous paper, Rapp (2024) estimated the temperature gain since the 1800s vs. ppm CO2, but he assumed that the relation between temperature gain and CO2 ppm was linear, whereas here we find it is logarithmic [2020Rapp D. Estimate of temperature rise in the 21st century for various scenarios. IgMin Res. 2024 Jul 11;2(7):564–569. IgMin ID: igmin218. doi:10.61927/igmin218. Available from: https://igmin.link/p218] His estimates for temperature gain at high ppm CO2 were therefore too high. We compare estimates for temperature gain vs. ppm CO2 from Rapp (2024), the present calculation, and Best’s estimate in Figure 7. The present model has the temperature gain at 1.5 °C for 425 ppm and predicts a temperature gain of 3.0 °C at 680 ppm.
1919Best C. Radiative forcing of CO2. 2013 Feb 27. Available from: https://clivebest.com/blog/?p=4698], and Rapp’s previous model [2020Rapp D. Estimate of temperature rise in the 21st century for various scenarios. IgMin Res. 2024 Jul 11;2(7):564–569. IgMin ID: igmin218. doi:10.61927/igmin218. Available from: https://igmin.link/p218]." /> Figure 7: Comparison of present calculation (Rapp Model), Best’s calculation [1919Best C. Radiative forcing of CO2. 2013 Feb 27. Available from: https://clivebest.com/blog/?p=4698], and Rapp’s previous model [2020Rapp D. Estimate of temperature rise in the 21st century for various scenarios. IgMin Res. 2024 Jul 11;2(7):564–569. IgMin ID: igmin218. doi:10.61927/igmin218. Available from: https://igmin.link/p218].
The model can be tested for the recent past by downloading CO2 data and estimated global average temperature data from NOAA, and thereby relating the two since 1980. The result is shown in Figure 8. The model runs consistently high compared to the data. However, it is well known that in this period, power plants emitted copious amounts of aerosols that had a cooling effect to slightly reduce global warming from CO2 [2121NASA. Aerosols: small particles with big climate effects. Available from: https://science.nasa.gov/science-research/earth-science/climate-science/aerosols-small-particles-with-big-climate-effects/]. Since then, aerosol emissions have been greatly reduced, and the curve of temperature gain vs. CO2 has increased.
Figure 8: Comparison of the model to the data for temperature vs. CO2 from 1980 to 2025.
Consequences for the 21st century
The relationship between temperature growth since the 1800s to CO2 concentration at any date in the 21st century is given by:
T(ppm) – T(275 ppm) = 3.43 LN(ppm/275).
We can use this relationship to estimate the growth in temperatures since the 1800s for any arbitrary scenario for CO2 emissions in the 21st century. Our model will be based on annual emissions of CO2, but we have a relationship between temperature and ppm of CO2. Therefore, we need an estimate of the increase in ppm CO2 for each Gt of CO2 emitted. This was provided by Rapp (2024) [2020Rapp D. Estimate of temperature rise in the 21st century for various scenarios. IgMin Res. 2024 Jul 11;2(7):564–569. IgMin ID: igmin218. doi:10.61927/igmin218. Available from: https://igmin.link/p218].
The Earth's atmosphere has an estimated mass of 5.15 x 10⁶ Gt. The molecular weight of the atmosphere is about MW ~ 28.96. The atmosphere includes about (5.15 x 10⁶)/28.96 = 1.78 x 10⁵ moles and 1 Gt of CO2 is 1/44 = 0.0227 Moles. If 1 Gt CO2 remained in the atmosphere, the molar ratio of CO2 would be (0.0227)/(1.78 x 105)= 1.30 x 10-7 = 0.130 ppm
Thus, emission of 1 Gt CO2 would increase the concentration of CO2 in the atmosphere by 0.130 ppm – if it all remained in the atmosphere. Here, we assume that 50% of the emitted CO2 remains in the atmosphere, so that each Gt CO2 emitted by the world increases the CO2 concentration by 0.065 ppm. Thus, it would take the emission of 15.4 Gt CO2 to raise the concentration by 1 ppm.
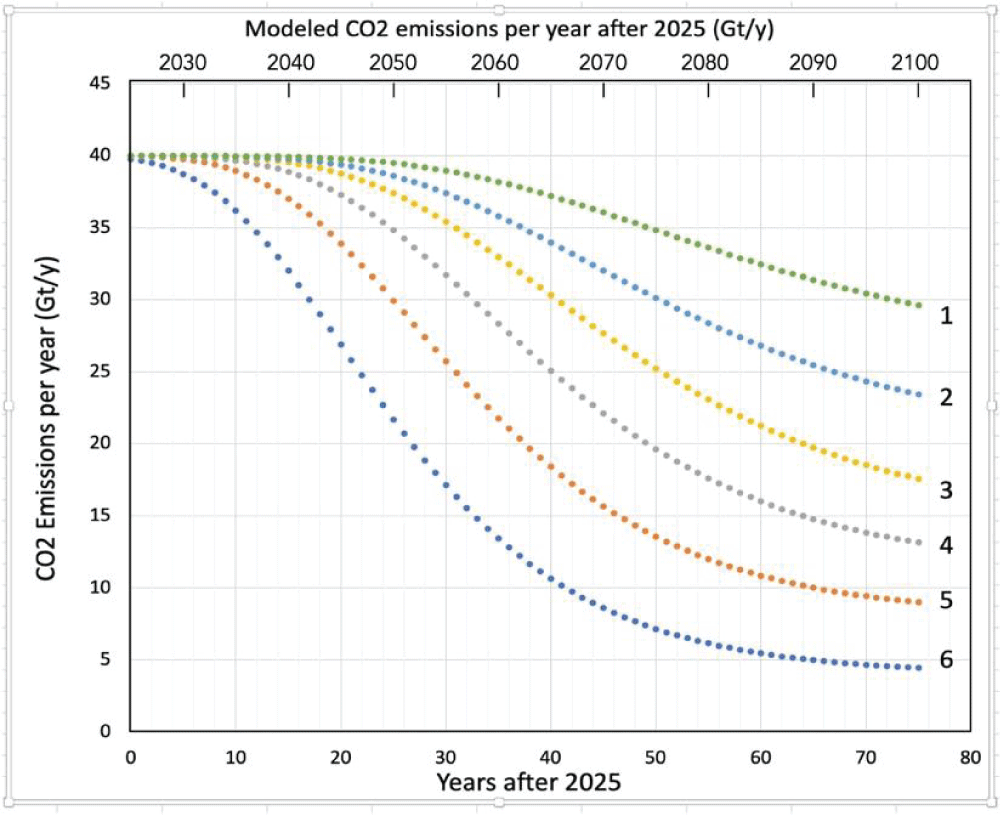
We consider several conceptual future scenarios for the emission of CO2 as shown in Figure 9.
Figure 9: Modeled CO2 emissions for the period 2025 to 2100 according to six scenarios.
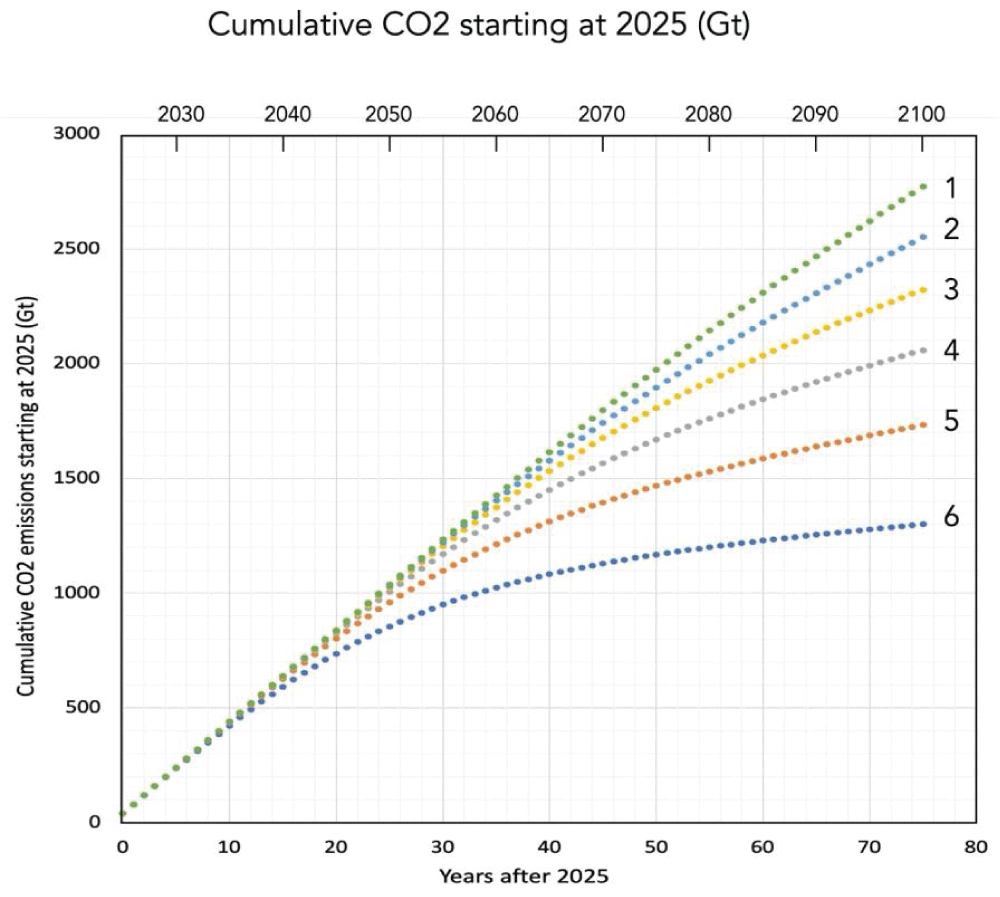
By summing up each year’s emissions from Figure 9, the cumulative emissions after 2025 can be determined as shown in Figure 10.
Figure 10: Modeled cumulative CO2 emissions for the period 2025 to 2100 according to six scenarios.
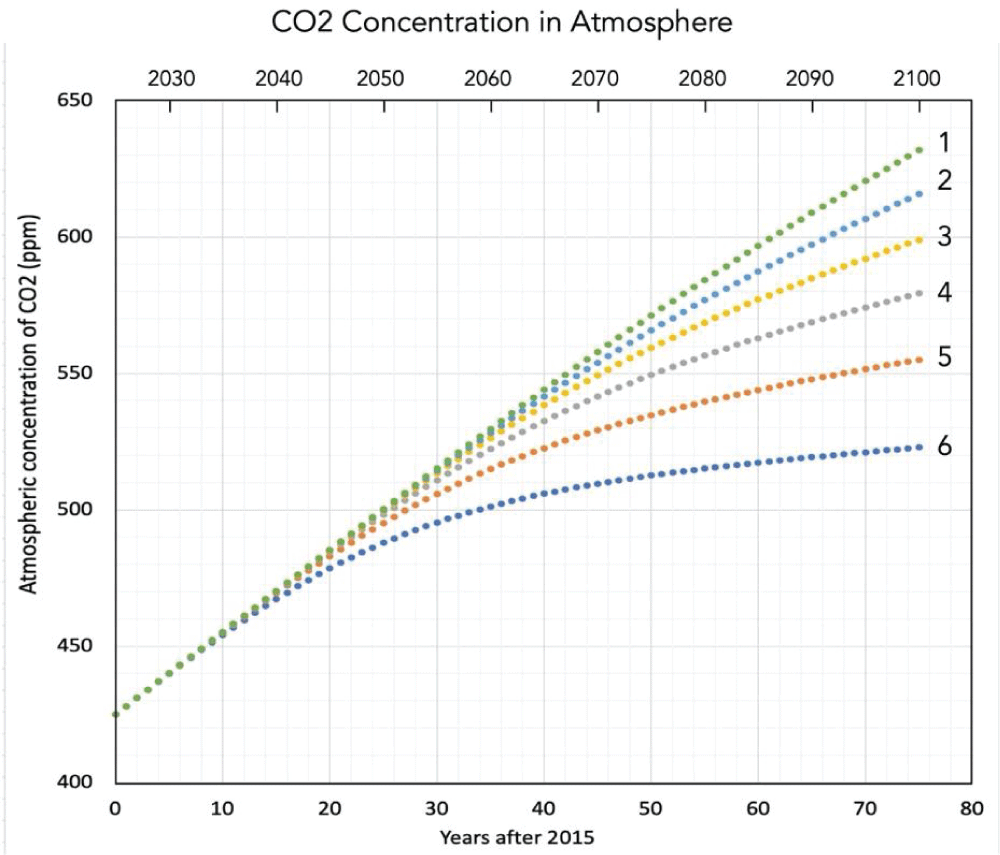
We previously derived the increase in CO2 ppm for any amount of CO2 emissions. That allows us to convert the cumulative emissions in Figure 10 to a plot of CO2 concentration as shown in Figure 11.
Figure 11: Modeled CO2 concentration (ppm) for the period 2025 to 2100 according to six scenarios.
Using the relationship between CO2 ppm and temperature gain since the 1800s shown in Figure 8, the data in Figure 11 is converted to a plot of temperature gain vs. year for each scenario as shown in Figure 12. Figure 12 provides government and institutional planners with reliable estimates of future temperature gain for various reasonable scenarios of future emissions.
Figure 12: Modeled temperature gain from the 1800s for the period 2025 to 2100 according to six scenarios.
In a previous paper, I pragmatically estimated global average temperatures in the 21st century for a set of hypothetical emission scenarios in the remainder of the century after 2015 [88Pierrehumbert RT. Infrared radiation and planetary temperature. Phys Today. 2011;64:33-38. doi:10.1063/1.3541943]. In that paper, I assumed that the temperature rise was proportional to the CO2 concentration, and I used pragmatic empirical data. The physics of warming by CO2 was not considered. Since then, I discovered the analysis of the physics by which increased CO2 produces global warming that Clive Best posted on a Blog, and he showed that the warming depends logarithmically on CO2 concentration, which indicates that my previous paper overestimated future warming because it used a linear relationship.
This paper provides a detailed quantitative analysis of the physics involved in the warming of the Earth by increased CO2. The atmosphere is divided into 150 100-meter layers, and CO2 irradiance (12-17-micron wavelength band) through these layers is modeled. Each layer radiates in the IR according to the Stefan-Boltzmann law at its temperature. As the CO2 concentration increases, the range of primary emitting layers increases in altitude, where it is on average cooler, reducing outward radiation from the Earth in the 12-17-micron wavelength band. The Earth must warm to compensate. The radiative forcing is the net loss in radiative power due to increased CO2. The radiative forcing was calculated vs. CO2 concentration – a very basic and important relationship in climate change analysis. Because Clive Best’s analysis is posted on a Blog where it is not noticed by search engines, it is not widely cited in the literature. In the present document, I am endeavoring to make his important work more widely known.
I related the forcing in the year 2025 to the known temperature increase from the 1800s and thus converted Best’s curve of radiative forcing vs. CO2 concentration to a curve of temperature gain from the 1800s vs. CO2 concentration (Figure 6). This plot is of fundamental importance in predicting future climate change and devising policies for mitigation. It indicates that we are likely to reach a temperature increase from the 1800s of 2.0 °C if CO2 reaches about 500 ppm, and 3.0 °C if CO2 reaches about 680 ppm.
I then proceeded to create six hypothetical scenarios for further CO2 emissions in the 21st century with a start date of 2025, using the logarithmic dependence of temperature on CO2 concentration, rather than the linear approximation used previously. The results span a range from 2.2 °C to 2.9 °C for the temperature increase from the 1800s to the year 2100, depending on the emission scenario.
The challenge for the world in the 21st century will be to provide the world with energy to support a robust global economy, while at the same time reducing CO2 emissions. There will be conflict between these two goals, and the actual future scenario will reflect the economic, technological, political, and social forces. The IPCC developed similar scenarios, but their scenarios are derived from specific allocations of various energy sources in the future [44Intergovernmental Panel on Climate Change (IPCC). Sixth Assessment Report. 2023. Available from: https://www.ipcc.ch/assessment-report/ar6/]. Based on current trends, Scenario 4 seems to be a reasonable guess.
The global effort to reduce CO2 emissions involves investment of very large sums, yet the proper scientific explanation of how CO2 warms the Earth is not widely understood. The primary objective of this research is to provide a clear, understandable description and quantitative model of the physics whereby increased CO2 produces global warming. A secondary objective is to provide an estimate of global temperatures in the 21st century for a range of potential future emission scenarios, which provides valuable information for planning future energy systems and government regulations.
This paper provides a clear, understandable description of the physics whereby increased CO2 produces global warming. It also provides insight into expected temperature gain in the 21st century for a range of potential future emission scenarios.
This model is not a full climate model. It does not take into account the main forces that act in the climate system. It focuses on one aspect of the climate that is likely to be a major factor, the effect of increasing CO2, reducing the ability of the Earth to radiate power to space. To the extent that this is a dominant factor in climate change from the 1800s to 2100, this can be taken as a guide for the likely temperature in the remainder of the 21st century.
van Wijngaarden WA, Happer W. Dependence of Earth’s thermal radiation on five most abundant greenhouse gases. arXiv [physics.ao-ph]. 2020. doi:10.48550/arXiv.2006.03098
Zhong W, Haigh JD. The greenhouse effect and carbon dioxide. Weather. 2013;68(4):100-105. doi:10.1002/wea.2072
Henry B. Scientific proof that CO2 does NOT cause global warming. World J Adv Res Rev. 2024;21(3):1688-1690. doi:10.30574/wjarr.2024.21.3.0884
Intergovernmental Panel on Climate Change (IPCC). Sixth Assessment Report. 2023. Available from: https://www.ipcc.ch/assessment-report/ar6/
Myhre G, Highwood EJ, Shine KP, Stordal F. New estimates of radiative forcing due to well-mixed greenhouse gases. Phys Rev Lett. 1998;80:2715-2718.
Dufresne J, Eymet V, Crevoisier C, Grandpeix JY. Greenhouse effect: the relative contributions of emission height and total absorption. J Climate. 2020;33:3827-3844. doi:10.1175/JCLI-D-19-0193.1
Miskolczi F. Greenhouse gas theories and observed radiative properties of the Earth’s atmosphere. 2023. Available from: https://www.researchgate.net/publication/374530216
Lindzen RS. Taking greenhouse warming seriously. Energy Environ. 2007;18:937-950.
Vinos J. The test that exonerates CO2. 2022. Available from: https://wattsupwiththat.com/2023/02/24/the-test-that-exonerates-co2/
Lindsey R. Climate and Earth’s Energy Budget. NASA Earth Observatory. 2009. Available from: https://earthobservatory.nasa.gov/features/EnergyBalance
Trenberth KE, Fasullo JT, Kiehl J. Earth’s global energy budget. 2009. Available from: https://journals.ametsoc.org/view/journals/bams/90/3/2008bams2634_1.xml
Wild M, Folini D, Schär C. The global energy balance from a surface perspective. 2012. Available from: https://link.springer.com/article/10.1007/s00382-012-1569-8
Stephens G, Li J, Wild M, et al. An update on Earth’s energy balance in light of the latest global observations. Nature Geosci. 2012;5:691–696. doi:10.1038/ngeo1580
Rapp D. How increased CO2 warms the Earth: two contexts for the greenhouse gas effect. IgMin Res. 2024 Oct 24;2(10):854–859. IgMin ID: igmin259. doi:10.61927/igmin259. Available from: https://igmin.link/p259
Best C. A collection of posts regarding the CO2 greenhouse effect and AGW. Available from: https://clivebest.com/blog/?page_id=6048
Best C. A simple model of the CO2 greenhouse effect. 2012 Nov 2. Available from: https://clivebest.com/blog/?p=4265
Best C. The CO2 GHE demystified. 2013 Feb 23. Available from: https://clivebest.com/blog/?p=4597
Best C. Radiative forcing of CO2. 2013 Feb 27. Available from: https://clivebest.com/blog/?p=4698
Rapp D. Estimate of temperature rise in the 21st century for various scenarios. IgMin Res. 2024 Jul 11;2(7):564–569. IgMin ID: igmin218. doi:10.61927/igmin218. Available from: https://igmin.link/p218
NASA. Aerosols: small particles with big climate effects. Available from: https://science.nasa.gov/science-research/earth-science/climate-science/aerosols-small-particles-with-big-climate-effects/
Rapp D. How Increased CO2 Warms the Earth. IgMin Res. December 09, 2025; 3(12): 454-461. IgMin ID: igmin324; DOI:10.61927/igmin324; Available at: igmin.link/p324
Address Correspondence: Donald Rapp, 1445 Indiana Ave., South Pasadena, CA 91030, USA, Email: [email protected]
How to cite this article: Rapp D. How Increased CO2 Warms the Earth. IgMin Res. December 09, 2025; 3(12): 454-461. IgMin ID: igmin324; DOI:10.61927/igmin324; Available at: igmin.link/p324
Copyright: 2025 Rapp D. This is an open access article distributed under the Creative Commons Attribution License, which permits unrestricted use, distribution, and reproduction in any medium, provided the original work is properly cited.
Figure 1: Model for temperature vs. altitude in the atmosphe...
Figure 2: CO2 emission height profiles for CO2 = 300 ppm and...
Figure 3: The temperature at CO2 emission heights for CO2 = ...
Figure 4: Radiant forcing = radiant emission at any ppm minu...
Figure 5: The difference between radiant emission in the 15-...
Figure 6: Estimate of temperature gain since the 1800s vs. p...
Figure 7: Comparison of present calculation (Rapp Model), Be...
Figure 8: Comparison of the model to the data for temperatur...
Figure 9: Modeled CO2 emissions for the period 2025 to 2100 ...
Figure 10: Modeled cumulative CO2 emissions for the period 20...
Figure 11: Modeled CO2 concentration (ppm) for the period 202...
Figure 12: Modeled temperature gain from the 1800s for the pe...
van Wijngaarden WA, Happer W. Dependence of Earth’s thermal radiation on five most abundant greenhouse gases. arXiv [physics.ao-ph]. 2020. doi:10.48550/arXiv.2006.03098
Zhong W, Haigh JD. The greenhouse effect and carbon dioxide. Weather. 2013;68(4):100-105. doi:10.1002/wea.2072
Henry B. Scientific proof that CO2 does NOT cause global warming. World J Adv Res Rev. 2024;21(3):1688-1690. doi:10.30574/wjarr.2024.21.3.0884
Intergovernmental Panel on Climate Change (IPCC). Sixth Assessment Report. 2023. Available from: https://www.ipcc.ch/assessment-report/ar6/
Myhre G, Highwood EJ, Shine KP, Stordal F. New estimates of radiative forcing due to well-mixed greenhouse gases. Phys Rev Lett. 1998;80:2715-2718.
Dufresne J, Eymet V, Crevoisier C, Grandpeix JY. Greenhouse effect: the relative contributions of emission height and total absorption. J Climate. 2020;33:3827-3844. doi:10.1175/JCLI-D-19-0193.1
Miskolczi F. Greenhouse gas theories and observed radiative properties of the Earth’s atmosphere. 2023. Available from: https://www.researchgate.net/publication/374530216
Lindzen RS. Taking greenhouse warming seriously. Energy Environ. 2007;18:937-950.
Vinos J. The test that exonerates CO2. 2022. Available from: https://wattsupwiththat.com/2023/02/24/the-test-that-exonerates-co2/
Lindsey R. Climate and Earth’s Energy Budget. NASA Earth Observatory. 2009. Available from: https://earthobservatory.nasa.gov/features/EnergyBalance
Trenberth KE, Fasullo JT, Kiehl J. Earth’s global energy budget. 2009. Available from: https://journals.ametsoc.org/view/journals/bams/90/3/2008bams2634_1.xml
Wild M, Folini D, Schär C. The global energy balance from a surface perspective. 2012. Available from: https://link.springer.com/article/10.1007/s00382-012-1569-8
Stephens G, Li J, Wild M, et al. An update on Earth’s energy balance in light of the latest global observations. Nature Geosci. 2012;5:691–696. doi:10.1038/ngeo1580
Rapp D. How increased CO2 warms the Earth: two contexts for the greenhouse gas effect. IgMin Res. 2024 Oct 24;2(10):854–859. IgMin ID: igmin259. doi:10.61927/igmin259. Available from: https://igmin.link/p259
Best C. A collection of posts regarding the CO2 greenhouse effect and AGW. Available from: https://clivebest.com/blog/?page_id=6048
Best C. A simple model of the CO2 greenhouse effect. 2012 Nov 2. Available from: https://clivebest.com/blog/?p=4265
Best C. The CO2 GHE demystified. 2013 Feb 23. Available from: https://clivebest.com/blog/?p=4597
Best C. Radiative forcing of CO2. 2013 Feb 27. Available from: https://clivebest.com/blog/?p=4698
Rapp D. Estimate of temperature rise in the 21st century for various scenarios. IgMin Res. 2024 Jul 11;2(7):564–569. IgMin ID: igmin218. doi:10.61927/igmin218. Available from: https://igmin.link/p218
NASA. Aerosols: small particles with big climate effects. Available from: https://science.nasa.gov/science-research/earth-science/climate-science/aerosols-small-particles-with-big-climate-effects/


 Scan and get link