IGMIN: We're glad you're here. Please click 'create a new query' if you are a new visitor to our website and need further information from us.
If you are already a member of our network and need to keep track of any developments regarding a question you have already submitted, click 'take me to my Query.'
Welcome to IgMin Research – an Open Access journal uniting Biology, Medicine, and Engineering. We’re dedicated to advancing global knowledge and fostering collaboration across scientific fields.
At IgMin Research, we bridge the frontiers of Biology, Medicine, and Engineering to foster interdisciplinary innovation. Our expanded scope now embraces a wide spectrum of scientific disciplines, empowering global researchers to explore, contribute, and collaborate through open access.
Welcome to IgMin, a leading platform dedicated to enhancing knowledge dissemination and professional growth across multiple fields of science, technology, and the humanities. We believe in the power of open access, collaboration, and innovation. Our goal is to provide individuals and organizations with the tools they need to succeed in the global knowledge economy.
IgMin Publications Inc., Suite 102, West Hartford, CT - 06110, USA
In this study, clustering of four distinct three-dimensional (3-D) objects—‘triangle-square’, ‘circle-square’, ‘triangle-circle’, and ‘square-triangle’—was performed using a phase-only digital holographic image dataset. The dataset was generated through Phase-Shifting Digital Holography (PSDH), wherein digital holograms of the objects were captured and numerically reconstructed to extract the corresponding phase images. To enhance dataset diversity, each phase image was subjected to rotational augmentation at 0.5-degree intervals, resulting in a total of 2880 images. Three clustering algorithms—k-means, affinity propagation, and mean shift—were independently applied to the dataset to evaluate their effectiveness in grouping the holographic phase images. The clustering performance was quantitatively assessed using a comprehensive set of evaluation metrics, including: accuracy score, Rand index, adjusted Rand index, mutual information score, adjusted mutual information score, homogeneity score, completeness score, V-measure, Fowlkes–Mallows index, silhouette score, Calinski–Harabasz index, and Davies–Bouldin index. In addition, the contingency matrix and pair confusion matrix were employed to further substantiate the clustering results. The performance of the k-means algorithm was benchmarked against the affinity propagation and mean shift methods to validate its relative efficacy. These comparative results provide a robust justification for the chosen methodology and offer insights into the suitability of clustering algorithms for phase-only digital holographic image analysis.
Digital holography is an advanced optoelectronic imaging technique that captures interferometric patterns of three-dimensional (3-D) objects using electronic image sensors such as charge-coupled device (CCD) or complementary metal-oxide-semiconductor (CMOS) sensors [11Schnars U, Falldorf C, Watson J. Digital holography and wavefront sensing: principles, techniques and applications. Berlin, Heidelberg: Springer; 2015. https://doi.org/10.1007/978-3-662-44693-5-44Schnars U, Jüptner W. Direct recording of holograms by a CCD target and numerical reconstruction. Appl Opt. 1994 Jan;33(2):179–81. https://doi.org/10.1364/AO.33.000179]. The captured interferograms are computationally reconstructed using the phase-shifting digital holography (PSDH) technique to extract both intensity and phase information of the object wavefront. The phase-only reconstructed images derived from PSDH serve as valuable inputs for machine learning-based applications, including classification, regression, and clustering tasks. Machine learning, a subfield of artificial intelligence, encompasses four primary learning paradigms: supervised learning, unsupervised learning, semi-supervised learning, and reinforcement learning [55Mitchell TM. Machine learning. 1st ed. New York: McGraw-Hill; 1997;1–421.]. In supervised learning, both input data and corresponding target labels are available, enabling the development of predictive models for tasks such as classification and regression. In contrast, unsupervised learning utilizes only input data without associated labels and is primarily employed for tasks such as clustering. Clustering, a fundamental unsupervised learning technique, partitions a dataset into distinct groups or clusters based on inherent patterns or similarities. Various clustering algorithms have been developed, including k-means, affinity propagation, mean shift, spectral clustering, Ward’s method, agglomerative clustering, DBSCAN, HDBSCAN, OPTICS, BIRCH, and Gaussian Mixture Models (GMM) [66Scikit-learn: Machine Learning in Python [Internet]. https://scikit-learn.org]. The k-means clustering algorithm partitions similar data points in a dataset into distinct groups or clusters based on proximity to cluster centroids. Similarity between data points is typically determined using a distance metric, most commonly the Euclidean distance [66Scikit-learn: Machine Learning in Python [Internet]. https://scikit-learn.org]. The algorithm begins with the random initialization of cluster centroids. Each data point is then assigned to the nearest centroid, forming initial clusters. Subsequently, the centroids are updated by computing the mean of all data points within each cluster. This assignment and update process is iteratively repeated until convergence, i.e., when cluster memberships stabilize and centroid positions no longer change significantly [66Scikit-learn: Machine Learning in Python [Internet]. https://scikit-learn.org]. Affinity propagation is a graph-based clustering algorithm that identifies exemplar data points and forms clusters through iterative message-passing between data point pairs [66Scikit-learn: Machine Learning in Python [Internet]. https://scikit-learn.org]. Two types of messages are exchanged: (a) responsibility, which quantifies how suitable a data point is to serve as the exemplar for another data point, and (b) availability, which indicates the appropriateness of a data point to choose another as its exemplar. Initially, all data points are considered as potential exemplars. The messages are updated iteratively based on other data point interactions, representing the relative suitability of one point to be the exemplar of another. This process continues until convergence, at which point clusters are formed based on the identified exemplars. The algorithm is governed by two key parameters: the preference, which influences the number of exemplars (and hence clusters), and the damping factor, which stabilizes the iterative message updates by reducing numerical oscillations [66Scikit-learn: Machine Learning in Python [Internet]. https://scikit-learn.org]. The mean-shift algorithm is a non-parametric, density-based clustering method that identifies clusters by locating the modes (peaks) of the data distribution. It operates by shifting data points iteratively towards the region of highest data density, effectively following the gradient of the density estimate [66Scikit-learn: Machine Learning in Python [Internet]. https://scikit-learn.org]. Each data point is initially treated as a candidate centroid. Using kernel density estimation, a search window (defined by a specified bandwidth) is centered on each point, and the mean of the points within the window is computed. The center of the window is then shifted to this mean, and the process is repeated until convergence—i.e., until the shifts become negligible. Once all points have converged to their respective modes, nearby converged points are grouped, and clusters are formed by merging points associated with the same peak in the data distribution.
Liu, et al. [77Liu R, Dey DK, Boss D, Marquet P, Javidi B. Recognition and classification of red blood cells using digital holographic microscopy and data clustering with discriminant analysis. J Opt Soc Am A Opt Image Sci Vis. 2011 Jun 1;28(6):1204-10. doi: 10.1364/JOSAA.28.001204. PMID: 21643406.] conducted recognition and classification of red blood cells using digital holographic microscopy (DHM) through model-based and k-means clustering approaches. Anand, et al. [88Liu R, Anand A, Dey DK, Javidi B. Entropy-based clustering of embryonic stem cells using digital holographic microscopy. J Opt Soc Am A Opt Image Sci Vis. 2014 Apr 1;31(4):677-84. doi: 10.1364/JOSAA.31.000677. PMID: 24695127.] introduced an entropy-based clustering technique for differentiating embryonic stem cells and fibroblast cells within DHM data. Thevar, et al.[99Liu Z, Thevar T, Takahashi T, Burns N, Yamada T, Sangekar M, Lindsay D, Watson J, Thornton B. Unsupervised feature learning and clustering of particles imaged in raw holograms using an autoencoder. J Opt Soc Am A Opt Image Sci Vis. 2021 Oct 1;38(10):1570-1580. doi: 10.1364/JOSAA.424271. PMID: 34612985.] applied unsupervised feature learning and clustering directly on raw holographic particle images. Qiuya Sun, et al. [1010Sun Q, Liu Y, Chen H, Jiang Z. Adaptive reconstruction imaging based on K-means clustering in off-axis digital holography. Opt Continuum. 2022 Mar;1(3):475–86. https://doi.org/10.1364/OPTCON.448824] proposed an adaptive image reconstruction framework utilizing k-means clustering in off-axis DHM. Reddy, et al. [1111Reddy BL, Uma Mahesh RN, Nelleri A. Deep convolutional neural network for three-dimensional objects classification using off-axis digital Fresnel holography. J Mod Opt. 2022;69(13):705–17. https://doi.org/10.1080/09500340.2022.2081371] developed a binary classification model employing a deep Convolutional Neural Network (CNN) to analyze a phase-only 3-D digital holographic image dataset. Absalom E. Ezugwu, et al.[1212Ezugwu AE, Ikotun AM, Oyelade OO, Abualigah L, Agushaka JO, Eke CI, Akinyelu AA. A comprehensive survey of clustering algorithms: State-of-the-art machine learning applications, taxonomy, challenges, and future research prospects. Eng Appl Artif Intell. 2022;110:104743. https://doi.org/10.1016/j.engappai.2022.104743] discussed different kinds of clustering algorithms applied to different domains, namely data science, computer science, statistics, pattern recognition, artificial intelligence, and machine learning. Seyed Mohamad Javidan, et al.[1313Javidan SM, Banakar A, Vakilian KA, Ampatzidis Y. Diagnosis of grape leaf diseases using automatic K-means clustering and machine learning. Smart Agric Technol. 2023;3:100081. https://doi.org/10.1016/j.atech.2022.100081] performed a diagnosis of grape leaf diseases using the k-means clustering algorithm. Shahneela Pitafi, et al.[1414Pitafi S, Anwar T, Sharif Z. A taxonomy of machine learning clustering algorithms, challenges, and future realms. Appl Sci. 2023;13(6):3529. https://doi.org/10.3390/app13063529] discussed several kinds of clustering algorithms and their challenges in the field of data science, pattern recognition, artificial intelligence, and machine learning. Meshal Shutaywi, et al. [1515Shutaywi M, Kachouie NN. Silhouette Analysis for Performance Evaluation in Machine Learning with Applications to Clustering. Entropy (Basel). 2021 Jun 16;23(6):759. doi: 10.3390/e23060759. PMID: 34208552; PMCID: PMC8234541.] performed silhouette analysis for performance evaluation in machine learning with applications to clustering.
In this study, clustering of four distinct three-dimensional (3-D) objects—‘triangle-square’, ‘circle-square’, ‘triangle-circle’, and ‘square-triangle’—was carried out using three unsupervised clustering algorithms: k-means, affinity propagation, and mean shift. Unlike previous works [77Liu R, Dey DK, Boss D, Marquet P, Javidi B. Recognition and classification of red blood cells using digital holographic microscopy and data clustering with discriminant analysis. J Opt Soc Am A Opt Image Sci Vis. 2011 Jun 1;28(6):1204-10. doi: 10.1364/JOSAA.28.001204. PMID: 21643406.-1515Shutaywi M, Kachouie NN. Silhouette Analysis for Performance Evaluation in Machine Learning with Applications to Clustering. Entropy (Basel). 2021 Jun 16;23(6):759. doi: 10.3390/e23060759. PMID: 34208552; PMCID: PMC8234541.], which primarily focused on cell classification or raw particle analysis, the present approach applies these clustering techniques to a phase-only digital holographic image dataset of 3-D objects [1616Uma Mahesh RN, Reddy BL, Nelleri A. Deep learning-based multi-class 3D objects classification using digital holographic complex images. In: Sivasubramanian A, Shastry PN, Hong PC, editors. Futuristic Communication and Network Technologies. VICFCNT 2020. Lecture Notes in Electrical Engineering, vol 792. Singapore: Springer; 2022. https://doi.org/10.1007/978-981-16-4625-6_43,1717Uma Mahesh RN, K B. Three-dimensional (3-D) objects classification by means of phase-only digital holographic information using Alex Network. In: 2024 International Conference on Signal Processing, Computation, Electronics, Power and Telecommunication (IConSCEPT); 2024; Karaikal, India. IEEE; 2024;1–5. doi:10.1109/IConSCEPT61884.2024.10627906]. Each object was assigned to a unique cluster: ‘triangle-square’ to cluster 1, ‘circle-square’ to cluster 2, ‘triangle-circle’ to cluster 3, and ‘square-triangle’ to cluster 4 [1818Mahesh RU, Nagaraju S. Three-dimensional (3-D) objects classification by means of phase-only digital holographic information using deep learning. In: Data Science & Exploration in Artificial Intelligence: Proceedings of the First International Conference on Data Science & Exploration in Artificial Intelligence (CODE-AI 2024); 2024 Jul 3–4; Bangalore, India. Volume 1. Boca Raton (FL): CRC Press; 2025;363. https://doi.org/10.1201/9781003587392-53]. The interferograms corresponding to these 3-D objects were generated using the phase-shifting digital holographic (PSDH) technique, followed by numerical reconstruction to obtain the phase-only holographic images [1818Mahesh RU, Nagaraju S. Three-dimensional (3-D) objects classification by means of phase-only digital holographic information using deep learning. In: Data Science & Exploration in Artificial Intelligence: Proceedings of the First International Conference on Data Science & Exploration in Artificial Intelligence (CODE-AI 2024); 2024 Jul 3–4; Bangalore, India. Volume 1. Boca Raton (FL): CRC Press; 2025;363. https://doi.org/10.1201/9781003587392-53]. These reconstructed images served as the input to the three clustering algorithms to evaluate their performance [66Scikit-learn: Machine Learning in Python [Internet]. https://scikit-learn.org]. A comprehensive set of evaluation metrics was employed to assess clustering quality, including accuracy score, Rand index, adjusted Rand index, adjusted mutual information score, mutual information score, homogeneity score, completeness score, V-measure, Fowlkes–Mallows index, silhouette score, Calinski–Harabasz index, and Davies–Bouldin index [66Scikit-learn: Machine Learning in Python [Internet]. https://scikit-learn.org]. In addition, the contingency matrix and pair confusion matrix were computed to provide further insight into cluster assignments and validation [66Scikit-learn: Machine Learning in Python [Internet]. https://scikit-learn.org]. Comparative analysis of the results from k-means clustering with those from affinity propagation and mean shift techniques demonstrates the relative performance and robustness of the proposed approach.
The major objective of this study is to evaluate three clustering algorithms, such as k-means, affinity propagation, and mean-shift clustering techniques were applied to the phase-only digital holographic image dataset of three-dimensional (3-D) objects obtained from interferograms, which has not been done in the works cited earlier [77Liu R, Dey DK, Boss D, Marquet P, Javidi B. Recognition and classification of red blood cells using digital holographic microscopy and data clustering with discriminant analysis. J Opt Soc Am A Opt Image Sci Vis. 2011 Jun 1;28(6):1204-10. doi: 10.1364/JOSAA.28.001204. PMID: 21643406.-1515Shutaywi M, Kachouie NN. Silhouette Analysis for Performance Evaluation in Machine Learning with Applications to Clustering. Entropy (Basel). 2021 Jun 16;23(6):759. doi: 10.3390/e23060759. PMID: 34208552; PMCID: PMC8234541.]. The novelty lies in the dataset of three-dimensional (3-D) objects for phase-only digital holographic information applied to three clustering algorithms. The results such as several evaluation metrics comprising accuracy score, Rand index, adjusted Rand index, adjusted mutual information score, mutual information score, homogeneity score, completeness score, V-measure, Fowlkes–Mallows index, silhouette score, Calinski–Harabasz index, and Davies–Bouldin index and contingency, pair confusion matrices have not been shown in the works cited earlier [77Liu R, Dey DK, Boss D, Marquet P, Javidi B. Recognition and classification of red blood cells using digital holographic microscopy and data clustering with discriminant analysis. J Opt Soc Am A Opt Image Sci Vis. 2011 Jun 1;28(6):1204-10. doi: 10.1364/JOSAA.28.001204. PMID: 21643406.-1515Shutaywi M, Kachouie NN. Silhouette Analysis for Performance Evaluation in Machine Learning with Applications to Clustering. Entropy (Basel). 2021 Jun 16;23(6):759. doi: 10.3390/e23060759. PMID: 34208552; PMCID: PMC8234541.].
The clustering of 3-D objects from the phase-only digital holographic image dataset was performed using three unsupervised learning algorithms: k-means, affinity propagation, and mean shift [66Scikit-learn: Machine Learning in Python [Internet]. https://scikit-learn.org]. Each clustering technique was independently applied to the phase-only digital holographic images, with the dataset serving as the input for all three algorithms to ensure a consistent comparative analysis. For all three clustering techniques, the size of the phase image considered was from 1024 × 1024. For k-means clustering, the number of clusters considered was nclusters = 4 to give the output [66Scikit-learn: Machine Learning in Python [Internet]. https://scikit-learn.org]. The number of clusters considered for the k-means clustering technique was four. For the affinity propagation technique, the preference parameter value considered was preference = –50, and the damping factor given was damping = 0.7 to produce the output [66Scikit-learn: Machine Learning in Python [Internet]. https://scikit-learn.org]. The preference parameter value considered was –50, and the damping factor considered was 0.7 to produce the result. For the mean-shift algorithm, the bandwidth was calculated using the estimated bandwidth function. In the estimated bandwidth function, the number of samples considered was nsamples = 500 and the quantile value considered was quantile = 0.05 to give the output [66Scikit-learn: Machine Learning in Python [Internet]. https://scikit-learn.org]. The quantile parameter helps to determine the bandwidth within the estimated bandwidth function, which in turn helps to identify the number of clusters or groups. The number of samples considered was 500, and the quantile value considered was 0.05 to find the bandwidth. The bandwidth parameter value considered for the mean-shift technique was zero.
Dataset preparation with results and discussions
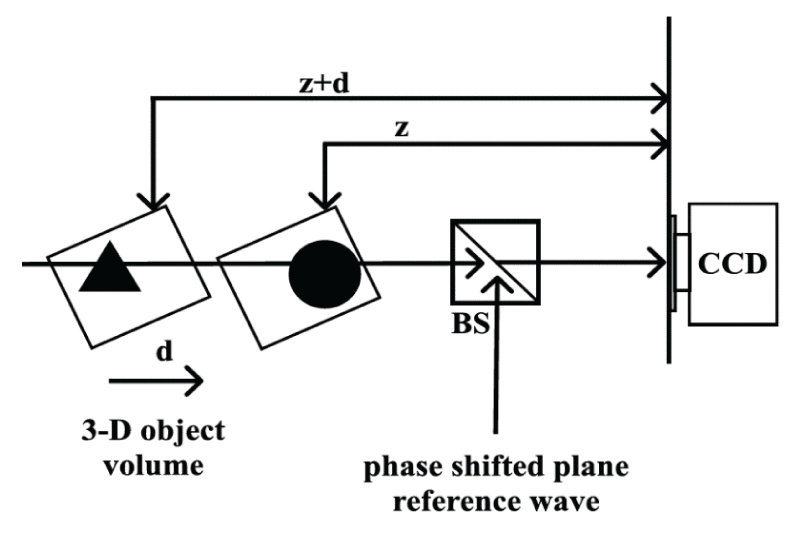
For the clustering task, four distinct 3-D object configurations—‘triangle-square’, ‘circle-square’, ‘square-triangle’, and‘triangle-circle’—were categorized into four separate clusters as described in [1818Mahesh RU, Nagaraju S. Three-dimensional (3-D) objects classification by means of phase-only digital holographic information using deep learning. In: Data Science & Exploration in Artificial Intelligence: Proceedings of the First International Conference on Data Science & Exploration in Artificial Intelligence (CODE-AI 2024); 2024 Jul 3–4; Bangalore, India. Volume 1. Boca Raton (FL): CRC Press; 2025;363. https://doi.org/10.1201/9781003587392-53]. Specifically, the ‘triangle-square’ object was assigned to Cluster 1, while the ‘circle-square’ object was grouped into Cluster 2. The ‘triangle-circle’ and ‘square-triangle’ objects were allocated to Clusters 3 and 4, respectively [1818Mahesh RU, Nagaraju S. Three-dimensional (3-D) objects classification by means of phase-only digital holographic information using deep learning. In: Data Science & Exploration in Artificial Intelligence: Proceedings of the First International Conference on Data Science & Exploration in Artificial Intelligence (CODE-AI 2024); 2024 Jul 3–4; Bangalore, India. Volume 1. Boca Raton (FL): CRC Press; 2025;363. https://doi.org/10.1201/9781003587392-53]. The 3-D object volume ‘square-triangle’ was designed such that the square feature appears in the first plane and the triangle feature in the second plane, preserving a structured spatial representation [1818Mahesh RU, Nagaraju S. Three-dimensional (3-D) objects classification by means of phase-only digital holographic information using deep learning. In: Data Science & Exploration in Artificial Intelligence: Proceedings of the First International Conference on Data Science & Exploration in Artificial Intelligence (CODE-AI 2024); 2024 Jul 3–4; Bangalore, India. Volume 1. Boca Raton (FL): CRC Press; 2025;363. https://doi.org/10.1201/9781003587392-53]. Both the planes are separated by distances. d1 And d2 respectively. The distance d1 corresponds to z. The distance d2 is corresponding to z + d. d is the distance between the first plane and the second plane. The remaining three 3-D objects were constructed following a similar methodology, with variations introduced by incorporating different geometric features—namely, circle, triangle, and square—positioned in the first and second planes as required. The first plane feature is propagated initially at a distance. z And then the second plane feature is propagated at a distance z + d. The interferograms are formed by superimposing the object wave, consisting of amplitude and phase information of both the planes and multiple reference waves formed at different phase shifts. 00 900, 1800, and 2700 respectively [1717Uma Mahesh RN, K B. Three-dimensional (3-D) objects classification by means of phase-only digital holographic information using Alex Network. In: 2024 International Conference on Signal Processing, Computation, Electronics, Power and Telecommunication (IConSCEPT); 2024; Karaikal, India. IEEE; 2024;1–5. doi:10.1109/IConSCEPT61884.2024.10627906,1818Mahesh RU, Nagaraju S. Three-dimensional (3-D) objects classification by means of phase-only digital holographic information using deep learning. In: Data Science & Exploration in Artificial Intelligence: Proceedings of the First International Conference on Data Science & Exploration in Artificial Intelligence (CODE-AI 2024); 2024 Jul 3–4; Bangalore, India. Volume 1. Boca Raton (FL): CRC Press; 2025;363. https://doi.org/10.1201/9781003587392-53]. These four interferograms were further post-processed using the PSDH technique to obtain intensity and phase images. The intensity/phase images and interferograms are of size. 1024 × 1024 [1818Mahesh RU, Nagaraju S. Three-dimensional (3-D) objects classification by means of phase-only digital holographic information using deep learning. In: Data Science & Exploration in Artificial Intelligence: Proceedings of the First International Conference on Data Science & Exploration in Artificial Intelligence (CODE-AI 2024); 2024 Jul 3–4; Bangalore, India. Volume 1. Boca Raton (FL): CRC Press; 2025;363. https://doi.org/10.1201/9781003587392-53]. The intensity and phase images of the four 3-D objects were captured at two different propagation distances [1818Mahesh RU, Nagaraju S. Three-dimensional (3-D) objects classification by means of phase-only digital holographic information using deep learning. In: Data Science & Exploration in Artificial Intelligence: Proceedings of the First International Conference on Data Science & Exploration in Artificial Intelligence (CODE-AI 2024); 2024 Jul 3–4; Bangalore, India. Volume 1. Boca Raton (FL): CRC Press; 2025;363. https://doi.org/10.1201/9781003587392-53]. For each 3-D object, four phase-shifted interferograms were recorded at the camera plane, corresponding to four distinct phase-shift values. These interferograms were subsequently processed using a four-step PSDH technique to reconstruct a 2D complex-valued image containing both intensity and phase information. The magnitude (absolute value) of the reconstructed 2D complex-valued digital image represents the intensity information, while the phase component is obtained by computing the arctangent of the ratio of the imaginary to real parts of the complex image. The construction of the 3-D object volume ‘triangle-circle’ is illustrated in Figure 1, where the triangle feature is located in the first plane and the circle feature in the second plane. Additionally, Figure 1 presents a schematic representation of the experimental setup used for recording interferograms, based on four-step phase-shifted plane reference waves [1818Mahesh RU, Nagaraju S. Three-dimensional (3-D) objects classification by means of phase-only digital holographic information using deep learning. In: Data Science & Exploration in Artificial Intelligence: Proceedings of the First International Conference on Data Science & Exploration in Artificial Intelligence (CODE-AI 2024); 2024 Jul 3–4; Bangalore, India. Volume 1. Boca Raton (FL): CRC Press; 2025;363. https://doi.org/10.1201/9781003587392-53].
Figure 1: Recording of an interferogram of a 3-D object volume ‘triangle-circle’ with the triangle feature positioned in the first plane and the circle feature positioned in the second plane, and separating distances z = 3 cm and d = 2 cm. BS: beam splitter, CCD: charge-coupled device. (a) triangle-circle.
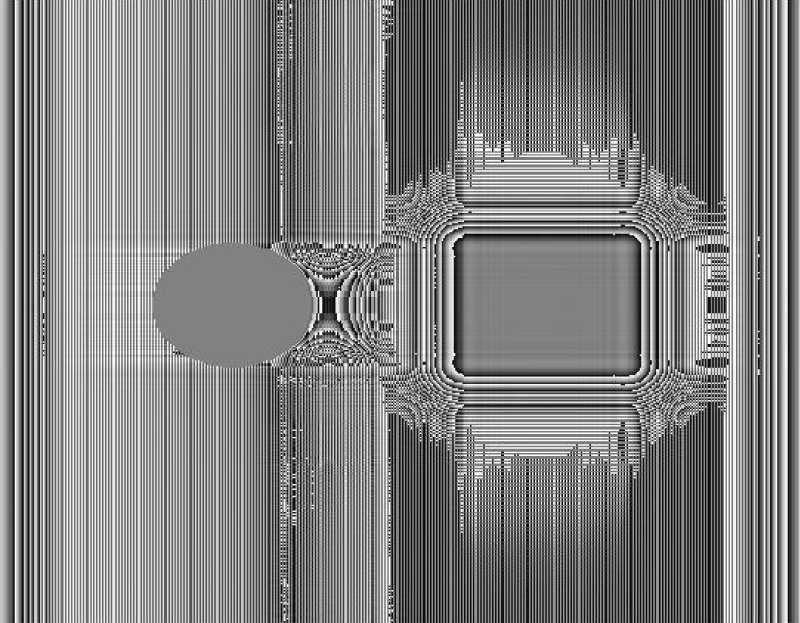
The interferograms corresponding to the four 3-D objects were categorized into four distinct clusters, and a dataset comprising 2880 interferograms was generated by applying rotational augmentation to each interferogram in incremental steps, as described in [1717Uma Mahesh RN, K B. Three-dimensional (3-D) objects classification by means of phase-only digital holographic information using Alex Network. In: 2024 International Conference on Signal Processing, Computation, Electronics, Power and Telecommunication (IConSCEPT); 2024; Karaikal, India. IEEE; 2024;1–5. doi:10.1109/IConSCEPT61884.2024.10627906]. Subsequently, a corresponding dataset of 2880 intensity and phase images was created by independently rotating each image in 0.5-degree increments [1717Uma Mahesh RN, K B. Three-dimensional (3-D) objects classification by means of phase-only digital holographic information using Alex Network. In: 2024 International Conference on Signal Processing, Computation, Electronics, Power and Telecommunication (IConSCEPT); 2024; Karaikal, India. IEEE; 2024;1–5. doi:10.1109/IConSCEPT61884.2024.10627906]. Both the interferogram and intensity/phase image datasets were generated using MATLAB [1818Mahesh RU, Nagaraju S. Three-dimensional (3-D) objects classification by means of phase-only digital holographic information using deep learning. In: Data Science & Exploration in Artificial Intelligence: Proceedings of the First International Conference on Data Science & Exploration in Artificial Intelligence (CODE-AI 2024); 2024 Jul 3–4; Bangalore, India. Volume 1. Boca Raton (FL): CRC Press; 2025;363. https://doi.org/10.1201/9781003587392-53]. For the clustering task, the phase-only image dataset was utilized and partitioned into training (75%), validation (15%), and test (10%) subsets [1818Mahesh RU, Nagaraju S. Three-dimensional (3-D) objects classification by means of phase-only digital holographic information using deep learning. In: Data Science & Exploration in Artificial Intelligence: Proceedings of the First International Conference on Data Science & Exploration in Artificial Intelligence (CODE-AI 2024); 2024 Jul 3–4; Bangalore, India. Volume 1. Boca Raton (FL): CRC Press; 2025;363. https://doi.org/10.1201/9781003587392-53]. Specifically, the training set comprised 2160 images, the validation set included 432 images, and the test set contained 288 images. The phase-only dataset was then subjected to three unsupervised clustering algorithms: k-means, affinity propagation, and mean-shift clustering techniques [66Scikit-learn: Machine Learning in Python [Internet]. https://scikit-learn.org]. For all three clustering algorithms, the size of the phase image considered was 160 ´ 106 from 1024 ´ 1024. The phase-image of the 3-D object ‘circle-square’ assigned to cluster 2 is shown in Figure 2 [1717Uma Mahesh RN, K B. Three-dimensional (3-D) objects classification by means of phase-only digital holographic information using Alex Network. In: 2024 International Conference on Signal Processing, Computation, Electronics, Power and Telecommunication (IConSCEPT); 2024; Karaikal, India. IEEE; 2024;1–5. doi:10.1109/IConSCEPT61884.2024.10627906,1818Mahesh RU, Nagaraju S. Three-dimensional (3-D) objects classification by means of phase-only digital holographic information using deep learning. In: Data Science & Exploration in Artificial Intelligence: Proceedings of the First International Conference on Data Science & Exploration in Artificial Intelligence (CODE-AI 2024); 2024 Jul 3–4; Bangalore, India. Volume 1. Boca Raton (FL): CRC Press; 2025;363. https://doi.org/10.1201/9781003587392-53]. In Figure 2, the circle feature is positioned in the first plane, which is a focused image, whereas the square feature is positioned in the second plane, which indicates a defocused image, since the phase-only image of the 3-D object ‘circle-square’ is reconstructed at a distance d1. All three clustering algorithms—k-means, affinity propagation, and mean-shift—were implemented using Python within a TensorFlow environment. The performance of these algorithms was evaluated on a test set comprising 24 phase-only images selected from the test dataset.
Figure 2: Phase image of a 3-D object, circle-square.
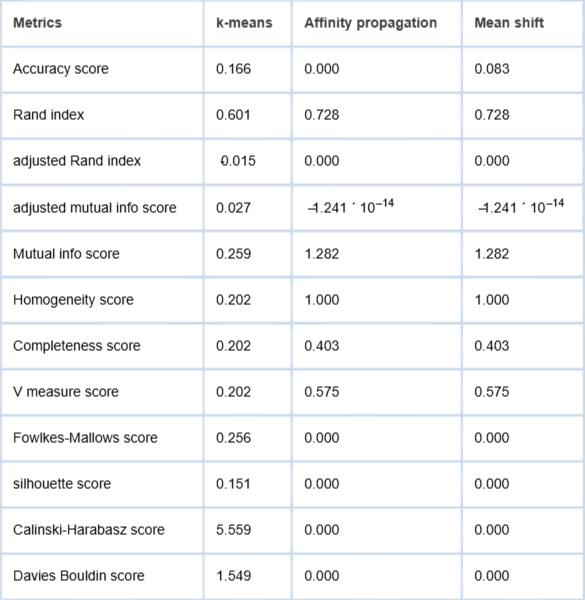
The clustering performance of the three algorithms was quantitatively evaluated using a comprehensive set of metrics, including accuracy score, Rand index, adjusted Rand index, adjusted mutual information score, mutual information score, homogeneity score, completeness score, V-measure score, Fowlkes–Mallows score, silhouette score, Calinski–Harabasz score, and Davies–Bouldin score. The results obtained for each clustering technique are summarized in Table 1 [66Scikit-learn: Machine Learning in Python [Internet]. https://scikit-learn.org]. The evaluation metrics are obtained on the test dataset by considering 24 images in a batch.
The accuracy score is defined as the ratio of correctly predicted labels to the total number of predictions made, serving as a basic measure of clustering effectiveness [1111Reddy BL, Uma Mahesh RN, Nelleri A. Deep convolutional neural network for three-dimensional objects classification using off-axis digital Fresnel holography. J Mod Opt. 2022;69(13):705–17. https://doi.org/10.1080/09500340.2022.2081371]. The Rand index quantifies the similarity between two data clusterings: the ground-truth labels and the predicted cluster assignments. Its value ranges from 0.0 to 1.0, where a score of 1.0 indicates perfect agreement between the true and predicted clusters, while a score of 0.0 reflects complete disagreement. A higher Rand index thus signifies better clustering performance [66Scikit-learn: Machine Learning in Python [Internet]. https://scikit-learn.org].
The Adjusted Rand Index (ARI) is a modified version of the Rand Index that accounts for chance groupings, providing a more reliable assessment of clustering performance. An ARI value of 1.0 indicates perfect agreement between the true and predicted labels, whereas a value of 0.0 suggests no similarity in the clustering assignments [66Scikit-learn: Machine Learning in Python [Internet]. https://scikit-learn.org]. The Mutual Information (MI) score measures the amount of shared information between the ground-truth and predicted cluster labels, reflecting the degree of agreement between the two assignments. Higher MI values indicate greater similarity between the clustering results, while lower values suggest weaker alignment [66Scikit-learn: Machine Learning in Python [Internet]. https://scikit-learn.org]. The Adjusted Mutual Information (AMI) score corrects the MI score for chance, yielding a more accurate evaluation of clustering quality, particularly in the presence of varying cluster sizes or label distributions [66Scikit-learn: Machine Learning in Python [Internet]. https://scikit-learn.org].
The homogeneity score assesses whether each cluster contains only data points from a single class. A score of 1.0 indicates that all data points within a cluster belong to the same class (perfect homogeneity), while a score of 0.0 indicates that the cluster contains data points from multiple classes [66Scikit-learn: Machine Learning in Python [Internet]. https://scikit-learn.org]. Conversely, the completeness score evaluates whether all data points of a given class are assigned to the same cluster. A score of 1.0 represents perfect completeness, where each class is entirely contained within a single cluster, whereas a score of 0.0 implies that the class is distributed across multiple clusters [66Scikit-learn: Machine Learning in Python [Internet]. https://scikit-learn.org]. The V-measure score is defined as the harmonic mean of the homogeneity and completeness scores. A V-measure score of 1.0 reflects perfect clustering alignment in terms of both homogeneity and completeness, while a score of 0.0 denotes poor clustering performance [66Scikit-learn: Machine Learning in Python [Internet]. https://scikit-learn.org].
The Fowlkes–Mallows score (FMI) measures the similarity between the true and predicted cluster assignments and is defined as the ratio of the number of true positive label pairs to the geometric mean of the total number of predicted positive pairs and actual positive pairs. An FMI score of 1.0 indicates perfect clustering alignment, whereas a score of 0.0 signifies poor similarity [66Scikit-learn: Machine Learning in Python [Internet]. https://scikit-learn.org]. The Silhouette score evaluates the cohesion and separation of clusters. The Silhouette score ranges from -1 to +1. A value close to +1 indicates that the data point is well clustered, meaning it is similar to others within its cluster and dissimilar to those in neighboring clusters. Conversely, a value near -1 suggests incorrect clustering, where the data point may be closer to a different cluster than to its own [66Scikit-learn: Machine Learning in Python [Internet]. https://scikit-learn.org].
The Calinski–Harabasz score evaluates clustering performance based on the ratio of between-cluster dispersion to within-cluster dispersion, serving as an indicator of cluster separation and compactness. It is formally defined as the ratio of the trace of the between-group dispersion matrix to the trace of the within-group dispersion matrix. A higher Calinski–Harabasz score suggests that clusters are well separated and internally cohesive, whereas a lower score indicates less distinct clustering. The Davies–Bouldin score measures the average similarity between clusters, where similarity is a function of the ratio between intra-cluster distances and inter-cluster distances. Lower values of the Davies–Bouldin score indicate better-defined and more separated clusters, while higher values suggest overlapping or poorly formed clusters [66Scikit-learn: Machine Learning in Python [Internet]. https://scikit-learn.org].
As shown in Table 1, the k-means clustering algorithm achieved an accuracy score of 0.16, a Rand index of 0.60, and an adjusted Rand index of -0.015, indicating poor clustering performance on the phase-only digital holographic image dataset. The negative adjusted Rand index further confirms the inconsistency between the predicted clusters and ground truth labels. The accuracy score obtained from the k-means clustering algorithm is also very low, which indicates that the k-means clustering technique has poor performance on the phase-only digital holographic image dataset. Additionally, the algorithm yielded an adjusted mutual information score of 0.027 and a mutual information score of 0.259. The lower value of the mutual information score further suggests that the k-means clustering technique has poor performance for clustering of 3-D objects on a phase-only digital holographic image dataset. The homogeneity, completeness, and V-measure scores were each 0.202, suggesting limited consistency and completeness within the clustering structure. The Fowlkes–Mallows score was 0.256. Furthermore, the silhouette score was 0.151, the Calinski–Harabasz score was 5.59, and the Davies–Bouldin score was 1.54, all indicating suboptimal cluster compactness and separation. Finally, the higher value of the Calinski-Harabasz score and Davies-Bouldin score indicates good performance for clustering of 3-D objects on a phase-only digital holographic image dataset. Even though the remaining metrics have very low performance except for the Calinski-Harabasz score and Davies-Bouldin score, overall, it can be said that the k-means clustering algorithm has very good performance for clustering of 3-D objects on a phase-only digital holographic image dataset.
Similarly, from Table 1, it can be said that the affinity propagation algorithm provides the evaluation metrics with values of 0.00, 0.728, 0.000, – 1.241 × 10⁻¹⁴, 1.282, 1.000, 0.403, 0.575, 0.000, 0.000, 0.000, and 0.000, respectively. A perfect homogeneity score of 1.00 achieved by the affinity propagation algorithm indicates highly effective clustering performance, suggesting that all data points within each cluster belong to a single class. This reflects strong consistency in grouping the 3-D objects from the phase-only digital holographic image dataset. The accuracy score of 0.00 suggests that none of the images among the four clusters were correctly predicted as either true negatives (TN) or true positives (TP). The higher value of the rand index obtained from the affinity propagation algorithm further suggests that the affinity propagation algorithm has good performance for clustering of 3-D objects for a phase-only digital holographic image dataset. The higher value of the mutual information score suggests that the affinity propagation algorithm has good performance, and the negative value of the adjusted mutual information score suggests that the affinity propagation algorithm has poor performance for clustering of 3-D objects on a phase-only digital holographic image dataset. The completeness and v-measure scores approach towards one, whereas the Fowlkes-Mallows score, silhouette-score, Calinski-Harabasz score, and Davies-Bouldin score, with values of 0.00, indicate that the affinity-propagation algorithm has poor clustering performance for clustering of 3-D objects on a phase-only digital holographic image dataset.
Table 1: Evaluation metrics obtained from the clustering techniques.
Finally, from Table 1, it can be said that the mean shift clustering algorithm provides the evaluation metrics with values of 0.083, 0.728, 0.000, 1.282, –1.241 × 10–14,1.000, 0.403, 0.575, 0.000, 0.000, 0.000, and 0.000. A homogeneity score of 1.00 obtained by the mean-shift clustering algorithm demonstrates its strong performance in accurately grouping the 3-D objects, with each cluster containing data points from a single class. This indicates effective clustering of the phase-only digital holographic image dataset. The lower values of the accuracy score, Calinski-Harabasz score, and Davies-Bouldin index indicate that the mean-shift clustering technique has poor performance for clustering of 3-D objects on a phase-only digital holographic image dataset. The accuracy score of 0.083 indicates that the accuracy is approaching zero, indicating zero images belonging to true negatives and true positives labels. The rand index of 0.728 and mutual info score of 1.282 indicate that the mean-shift technique has good clustering performance of 3-D objects for the phase-only digital holographic image dataset. The values of completeness and v-measure scores approaching one indicate that the mean-shift clustering technique has good performance for clustering of 3-D objects on a phase-only digital holographic image dataset, whereas zero values of Fowlkes-Mallows score, silhouette score, Calinski-Harabasz score, and Davies-Bouldin index indicate that the mean-shift technique has poor performance for clustering of 3-D objects on a phase-only digital holographic image dataset.
Overall, all three clustering algorithms have good performance for clustering of 3-D objects on a phase-only digital holographic image dataset. These results suggest that the k-means, affinity propagation, and mean shift techniques have contrasting values for evaluation metrics but are effective in accurately grouping 3-D objects in the phase-only digital holographic image dataset.
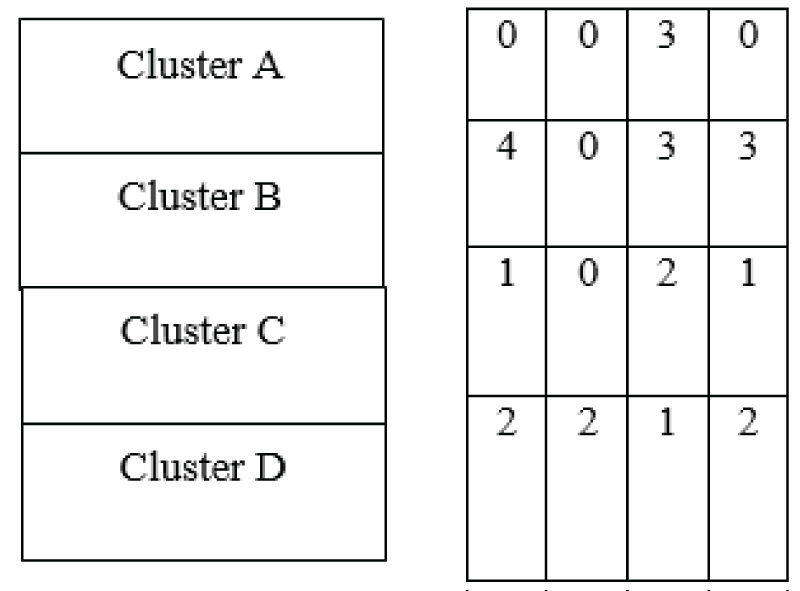
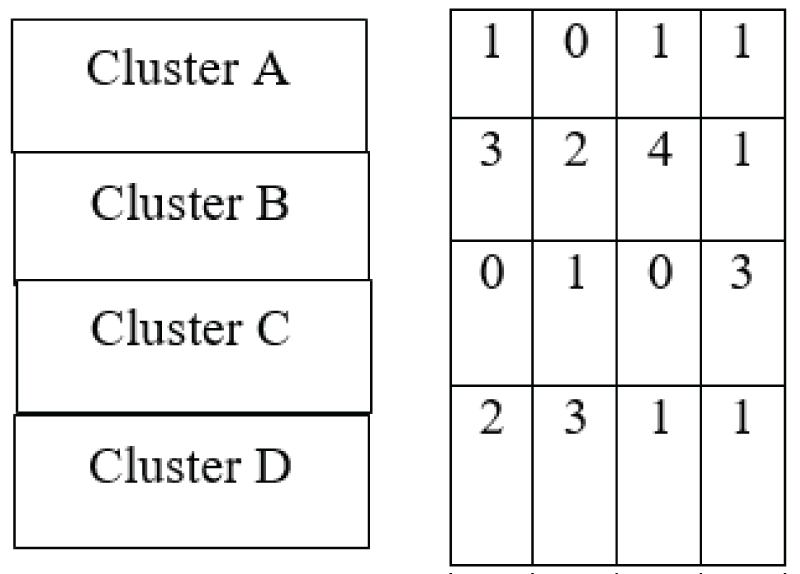
To further assess clustering performance, the contingency matrix and pair confusion matrix [1111Reddy BL, Uma Mahesh RN, Nelleri A. Deep convolutional neural network for three-dimensional objects classification using off-axis digital Fresnel holography. J Mod Opt. 2022;69(13):705–17. https://doi.org/10.1080/09500340.2022.2081371] for all three clustering algorithms are presented in Figure 3. The contingency matrix provides a quantitative evaluation of the overlap between true class labels and predicted cluster assignments by computing the intersection cardinality for each true/predicted cluster pair [66Scikit-learn: Machine Learning in Python [Internet]. https://scikit-learn.org]. The contingency matrix was also obtained by considering 24 images in a batch on a test dataset. The contingency matrix corresponding to the k-means clustering algorithm is specifically illustrated in Figure 3.
Figure 3: Contingency matrix obtained from the k-means clustering technique.
As illustrated in Figure 3, the contingency matrix for the k-means clustering algorithm provides insight into the distribution of true labels versus predicted cluster assignments. For Cluster A, which contains 3 images, all 3 were assigned to Cluster 3, with none assigned to Clusters 1, 2, or 4. i.e., the clusters 1, 2, 3, and 4 are assigned as clusters A, B, C, and D, respectively. For Cluster B, comprising 12 images, 4 were assigned to Cluster 1, 3 each to Clusters 3 and 4, and none to Cluster 2. Cluster C contains 4 images, of which 2 were assigned to Cluster 3, and 1 each to Clusters 1 and 4, with none assigned to Cluster 2. In Cluster D, consisting of 7 images, 2 images were assigned to each of Clusters 1, 2, and 4, while 1 image was assigned to Cluster 3. These results highlight the scattered and inconsistent mapping of true labels to predicted clusters in the k-means approach. The contingency matrix generated by the affinity propagation algorithm is presented in Figure 4 for comparative analysis.
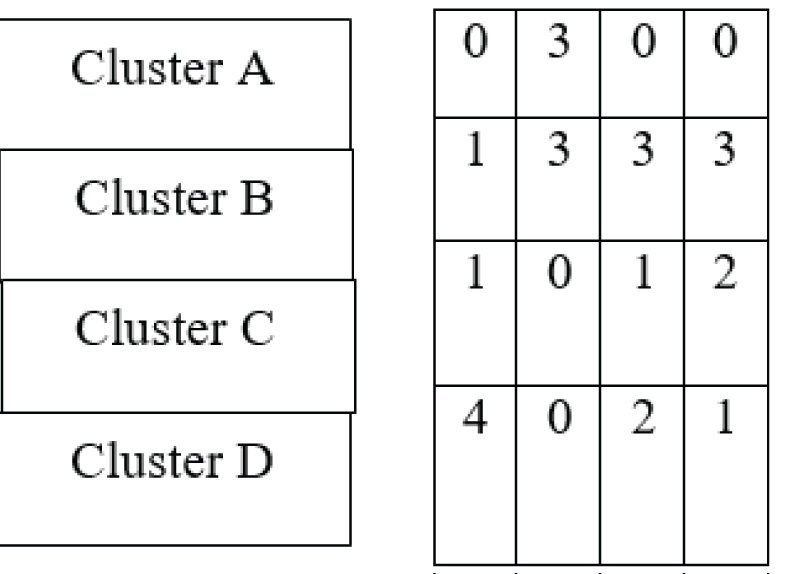
As depicted in Figure 4, the contingency matrix derived from the affinity propagation algorithm reveals the mapping between true class labels and predicted cluster assignments. For Cluster A, which contains 3 images, 1 image was assigned to each of Clusters 1, 2, and 4, with no assignments to Cluster 3. For Cluster B, comprising 10 images, 3 images were assigned to Cluster 1, 2 images to Cluster 2, 4 images to Cluster 3, and 1 image to Cluster 4. Cluster C, consisting of 4 images, had 1 image assigned to Cluster 2 and 3 images to Cluster 4, with none assigned to Clusters 1 and 3. Finally, for Cluster D, which contains 7 images, 2 images were assigned to Cluster 1, 3 images to Cluster 2, and 1 image each to Clusters 3 and 4. These results suggest a more balanced and representative distribution of predictions across clusters, indicating improved alignment with the ground truth compared to the k-means algorithm.
Figure 4: Contingency matrix obtained from the affinity propagation technique.
The contingency matrix generated by the mean-shift clustering algorithm is presented in Figure 5. As shown, for Cluster A, which contains 3 images, all 3 were assigned to Cluster 2, with no assignments to Clusters 1, 3, or 4. For Cluster B, comprising 10 images, 1 image was assigned to Cluster 1, and 3 images were assigned to each of Clusters 2, 3, and 4. In the case of Cluster C, which includes 4 images, 1 image was assigned to Cluster 1, 1 image to Cluster 3, 2 images to Cluster 4, and none to Cluster 2. Finally, for Cluster D, consisting of 7 images, 4 images were assigned to Cluster 1, 2 images to Cluster 3, and 1 image to Cluster 4, with no assignments to Cluster 2. These results indicate a more distinct and consistent distribution of predictions across clusters, reflecting the mean-shift algorithm’s ability to capture the underlying structure of the phase-only digital holographic image dataset.
Figure 5: Contingency matrix obtained from the mean shift technique.
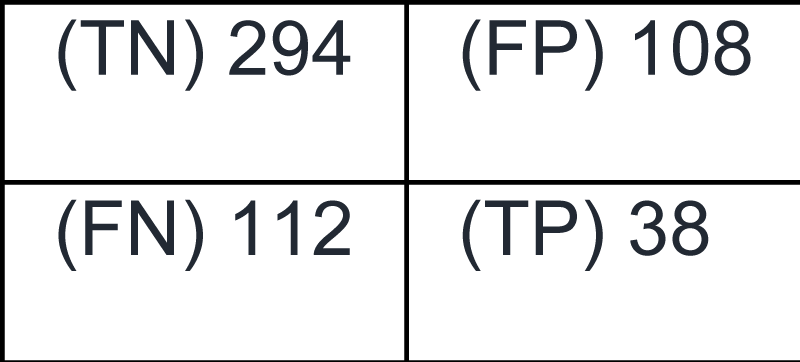
So, from the contingency matrices of each of the clustering algorithms, it can be said that the k-means, affinity propagation, and mean-shift techniques have good clustering performance and good clustering assignment to cluster D for clustering of 3-D objects on a phase-only digital holographic image dataset. Finally, the pair confusion matrix [1111Reddy BL, Uma Mahesh RN, Nelleri A. Deep convolutional neural network for three-dimensional objects classification using off-axis digital Fresnel holography. J Mod Opt. 2022;69(13):705–17. https://doi.org/10.1080/09500340.2022.2081371] is also employed to evaluate the performance of the clustering algorithms. This matrix is a 2×2 similarity matrix that compares the true and predicted clusterings by examining all possible pairs of data points. It quantifies the number of point pairs that are assigned to the same or different clusters in both the ground truth and predicted clusterings. The pair confusion matrix is obtained by considering 552 image pairs from true and predicted labels. The pair confusion matrix corresponding to the k-means clustering algorithm is shown in Figure 6.
As shown in Figure 6, the pair confusion matrix for the k-means clustering algorithm indicates that 294 image pairs were classified as true negatives (TN), 112 as false negatives (FN), 108 as false positives (FP), and 38 as true positives (TP) [1111Reddy BL, Uma Mahesh RN, Nelleri A. Deep convolutional neural network for three-dimensional objects classification using off-axis digital Fresnel holography. J Mod Opt. 2022;69(13):705–17. https://doi.org/10.1080/09500340.2022.2081371]. In total, 406 image pairs fall under the FALSE class (i.e., not clustered together in either clustering), while 146 pairs belong to the TRUE class (i.e., clustered together in at least one clustering) [1111Reddy BL, Uma Mahesh RN, Nelleri A. Deep convolutional neural network for three-dimensional objects classification using off-axis digital Fresnel holography. J Mod Opt. 2022;69(13):705–17. https://doi.org/10.1080/09500340.2022.2081371]. In this context, the label TN represents the number of pairs that are not grouped in both the ground truth and predicted clusterings [66Scikit-learn: Machine Learning in Python [Internet]. https://scikit-learn.org]. Similarly, the label FN refers to the number of pairs that are grouped in the true clustering but are assigned to different clusters in the predicted clustering. Next, the label FP denotes pairs that are not grouped in the true clustering but are incorrectly clustered together by the algorithm. Finally, the label TP represents pairs that are correctly grouped in both the true and predicted clusterings [66Scikit-learn: Machine Learning in Python [Internet]. https://scikit-learn.org].
Figure 6: Pair confusion matrix obtained from the k-means clustering algorithm.
The corresponding pair confusion matrix for the affinity propagation algorithm is illustrated in Figure 7 [1111Reddy BL, Uma Mahesh RN, Nelleri A. Deep convolutional neural network for three-dimensional objects classification using off-axis digital Fresnel holography. J Mod Opt. 2022;69(13):705–17. https://doi.org/10.1080/09500340.2022.2081371].
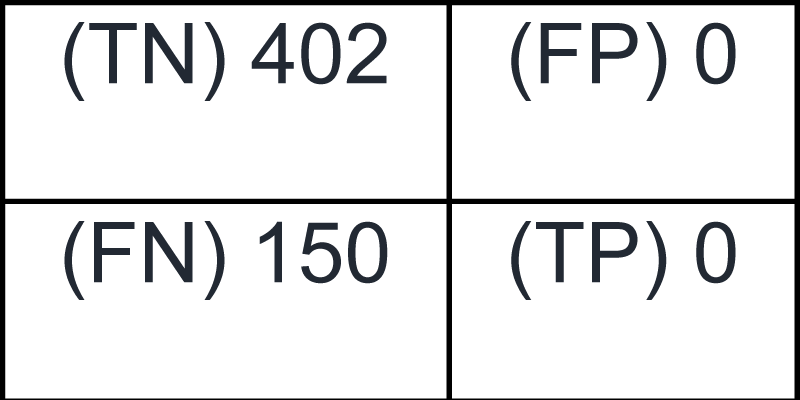
As depicted in Figure 7, the pair confusion matrix for the affinity propagation algorithm shows that all 552 image pairs fall under the FALSE class, with 0 pairs classified as belonging to the TRUE class [1111Reddy BL, Uma Mahesh RN, Nelleri A. Deep convolutional neural network for three-dimensional objects classification using off-axis digital Fresnel holography. J Mod Opt. 2022;69(13):705–17. https://doi.org/10.1080/09500340.2022.2081371]. Specifically, 402 pairs were identified as TN and 150 as FN [66Scikit-learn: Machine Learning in Python [Internet]. https://scikit-learn.org], while no pairs were classified as FP or TP. These results indicate that the algorithm failed to correctly group any image pairs into the same cluster, despite accurately identifying several pairs that should not be grouped. The pair confusion matrix corresponding to the mean-shift clustering algorithm is presented in Figure 8.
Figure 7: Pair confusion matrix obtained from the affinity propagation algorithm.
Figure 8: Pair confusion matrix obtained from the mean shift algorithm.
As shown in Figure 8, the pair confusion matrix derived from the mean-shift clustering algorithm indicates that all 552 image pairs belong to the FALSE class, with 0 pairs assigned to the TRUE class [1111Reddy BL, Uma Mahesh RN, Nelleri A. Deep convolutional neural network for three-dimensional objects classification using off-axis digital Fresnel holography. J Mod Opt. 2022;69(13):705–17. https://doi.org/10.1080/09500340.2022.2081371]. Among these, 402 pairs were classified as TN and 150 as FN. No pairs were identified as FP or TP. These results suggest that while the mean-shift algorithm effectively avoids incorrect pairings, it fails to correctly group any data point pairs into the same cluster, resulting in no correctly identified cluster agreements.
In this study, the clustering of 3-D objects was performed on a phase-only digital holographic image dataset comprising four distinct object classes: ‘triangle-square’, ‘circle-square’, ‘triangle-circle’, and ‘square-triangle’. These were respectively assigned to Clusters 1 through 4 [1818Mahesh RU, Nagaraju S. Three-dimensional (3-D) objects classification by means of phase-only digital holographic information using deep learning. In: Data Science & Exploration in Artificial Intelligence: Proceedings of the First International Conference on Data Science & Exploration in Artificial Intelligence (CODE-AI 2024); 2024 Jul 3–4; Bangalore, India. Volume 1. Boca Raton (FL): CRC Press; 2025;363. https://doi.org/10.1201/9781003587392-53]. The interferograms of the 3-D objects were acquired using a four-step PSDH technique and subsequently reconstructed to obtain corresponding intensity and phase images. A phase-only image dataset consisting of 2880 images was generated and utilized for unsupervised clustering using three algorithms: k-means, affinity propagation, and mean-shift. The performance of each clustering technique was evaluated using a comprehensive set of quantitative metrics, including accuracy score, Rand index, adjusted Rand index, mutual information score, adjusted mutual information score, homogeneity score, completeness score, V-measure score, Fowlkes–Mallows score, silhouette score, Calinski–Harabasz score, and Davies–Bouldin score [66Scikit-learn: Machine Learning in Python [Internet]. https://scikit-learn.org]. To further validate the clustering results, contingency matrices and pair confusion matrices were analyzed for each method [66Scikit-learn: Machine Learning in Python [Internet]. https://scikit-learn.org]. A homogeneity score of 1.00 achieved by both the affinity propagation and mean-shift algorithms indicates superior clustering performance relative to the k-means algorithm for this dataset. The accuracy score obtained from the k-means clustering algorithm is also very low, which indicates that the k-means clustering technique has poor performance on the phase-only digital holographic image dataset. The lower value of the mutual information score further suggests that the k-means clustering technique has poor performance for clustering of 3-D objects on a phase-only digital holographic image dataset. Next, the lower values of homogeneity, completeness, and V-measure scores, along with a lower value of the Fowlkes-Mallows score, indicate that the k-means clustering algorithm has poor clustering performance for clustering of 3-D objects on a phase-only digital holographic image dataset. Additionally, the contingency matrix results reveal that all three algorithms assigned a relatively higher number of images to Cluster B compared to the other clusters. Overall, this work demonstrates the application and comparative analysis of k-means, affinity propagation, and mean-shift algorithms for the clustering of 3-D objects in a phase-only digital holographic imaging context. Finally, it can be concluded that the clustering of 3-D objects has been performed using k-means, affinity propagation, and mean shift techniques for clustering of 3-D objects on a phase-only digital holographic image dataset. Further in the future, the clustering of 3-D objects can be performed using spectral and hierarchical clustering algorithms on a phase-only digital holographic image dataset.
Author contributions
The authors confirm their contribution to the paper as follows: First author-design, data collection, analysis and interpretation of results, manuscript preparation; Second author-supervision, conceptualization, manuscript review and editing. All authors reviewed the manuscript.
Schnars U, Falldorf C, Watson J. Digital holography and wavefront sensing: principles, techniques and applications. Berlin, Heidelberg: Springer; 2015. https://doi.org/10.1007/978-3-662-44693-5
Goodman JW. Introduction to Fourier optics. 4th ed. New York: W.H. Freeman; 2017.
Goodman JW, Lawrence RW. Digital image formation from electronically detected holograms. Appl Phys Lett. 1967 Jul;11(3):77–9. doi:10.1063/1.1755043
Schnars U, Jüptner W. Direct recording of holograms by a CCD target and numerical reconstruction. Appl Opt. 1994 Jan;33(2):179–81. https://doi.org/10.1364/AO.33.000179
Mitchell TM. Machine learning. 1st ed. New York: McGraw-Hill; 1997;1–421.
Scikit-learn: Machine Learning in Python [Internet]. https://scikit-learn.org
Liu R, Dey DK, Boss D, Marquet P, Javidi B. Recognition and classification of red blood cells using digital holographic microscopy and data clustering with discriminant analysis. J Opt Soc Am A Opt Image Sci Vis. 2011 Jun 1;28(6):1204-10. doi: 10.1364/JOSAA.28.001204. PMID: 21643406.
Liu R, Anand A, Dey DK, Javidi B. Entropy-based clustering of embryonic stem cells using digital holographic microscopy. J Opt Soc Am A Opt Image Sci Vis. 2014 Apr 1;31(4):677-84. doi: 10.1364/JOSAA.31.000677. PMID: 24695127.
Liu Z, Thevar T, Takahashi T, Burns N, Yamada T, Sangekar M, Lindsay D, Watson J, Thornton B. Unsupervised feature learning and clustering of particles imaged in raw holograms using an autoencoder. J Opt Soc Am A Opt Image Sci Vis. 2021 Oct 1;38(10):1570-1580. doi: 10.1364/JOSAA.424271. PMID: 34612985.
Sun Q, Liu Y, Chen H, Jiang Z. Adaptive reconstruction imaging based on K-means clustering in off-axis digital holography. Opt Continuum. 2022 Mar;1(3):475–86. https://doi.org/10.1364/OPTCON.448824
Reddy BL, Uma Mahesh RN, Nelleri A. Deep convolutional neural network for three-dimensional objects classification using off-axis digital Fresnel holography. J Mod Opt. 2022;69(13):705–17. https://doi.org/10.1080/09500340.2022.2081371
Ezugwu AE, Ikotun AM, Oyelade OO, Abualigah L, Agushaka JO, Eke CI, Akinyelu AA. A comprehensive survey of clustering algorithms: State-of-the-art machine learning applications, taxonomy, challenges, and future research prospects. Eng Appl Artif Intell. 2022;110:104743. https://doi.org/10.1016/j.engappai.2022.104743
Javidan SM, Banakar A, Vakilian KA, Ampatzidis Y. Diagnosis of grape leaf diseases using automatic K-means clustering and machine learning. Smart Agric Technol. 2023;3:100081. https://doi.org/10.1016/j.atech.2022.100081
Pitafi S, Anwar T, Sharif Z. A taxonomy of machine learning clustering algorithms, challenges, and future realms. Appl Sci. 2023;13(6):3529. https://doi.org/10.3390/app13063529
Shutaywi M, Kachouie NN. Silhouette Analysis for Performance Evaluation in Machine Learning with Applications to Clustering. Entropy (Basel). 2021 Jun 16;23(6):759. doi: 10.3390/e23060759. PMID: 34208552; PMCID: PMC8234541.
Uma Mahesh RN, Reddy BL, Nelleri A. Deep learning-based multi-class 3D objects classification using digital holographic complex images. In: Sivasubramanian A, Shastry PN, Hong PC, editors. Futuristic Communication and Network Technologies. VICFCNT 2020. Lecture Notes in Electrical Engineering, vol 792. Singapore: Springer; 2022. https://doi.org/10.1007/978-981-16-4625-6_43
Uma Mahesh RN, K B. Three-dimensional (3-D) objects classification by means of phase-only digital holographic information using Alex Network. In: 2024 International Conference on Signal Processing, Computation, Electronics, Power and Telecommunication (IConSCEPT); 2024; Karaikal, India. IEEE; 2024;1–5. doi:10.1109/IConSCEPT61884.2024.10627906
Mahesh RU, Nagaraju S. Three-dimensional (3-D) objects classification by means of phase-only digital holographic information using deep learning. In: Data Science & Exploration in Artificial Intelligence: Proceedings of the First International Conference on Data Science & Exploration in Artificial Intelligence (CODE-AI 2024); 2024 Jul 3–4; Bangalore, India. Volume 1. Boca Raton (FL): CRC Press; 2025;363. https://doi.org/10.1201/9781003587392-53
Uma Mahesh RN, Madhusudhan KV. Clustering of Three-dimensional (3-D) Objects by Means of Phase- only Digital Holographic Information using Machine Learning. IgMin Res. October 22, 2025; 3(10): 379-386. IgMin ID: igmin318; DOI:10.61927/igmin318; Available at: igmin.link/p318
1Associate Professor, Department of CSE (AI&ML), ATME College of Engineering, Mysore, Karnataka, India
2Associate Professor, Department of Mathematics, ATME College of Engineering, Mysore, Karnataka, India
Address Correspondence: Uma Mahesh RN, ATME College of Engineering, Mysore, Karnataka, India, Email: [email protected]
How to cite this article: Uma Mahesh RN, Madhusudhan KV. Clustering of Three-dimensional (3-D) Objects by Means of Phase- only Digital Holographic Information using Machine Learning. IgMin Res. October 22, 2025; 3(10): 379-386. IgMin ID: igmin318; DOI:10.61927/igmin318; Available at: igmin.link/p318
Figure 1: Recording of an interferogram of a 3-D object volu...
Figure 2: Phase image of a 3-D object, circle-square....
Figure 3: Contingency matrix obtained from the k-means clust...
Figure 4: Contingency matrix obtained from the affinity prop...
Figure 5: Contingency matrix obtained from the mean shift te...
Figure 6: Pair confusion matrix obtained from the k-means cl...
Figure 7: Pair confusion matrix obtained from the affinity p...
Figure 8: Pair confusion matrix obtained from the mean shift...
Table 1: Evaluation metrics obtained from the clustering te...
Schnars U, Falldorf C, Watson J. Digital holography and wavefront sensing: principles, techniques and applications. Berlin, Heidelberg: Springer; 2015. https://doi.org/10.1007/978-3-662-44693-5
Goodman JW. Introduction to Fourier optics. 4th ed. New York: W.H. Freeman; 2017.
Goodman JW, Lawrence RW. Digital image formation from electronically detected holograms. Appl Phys Lett. 1967 Jul;11(3):77–9. doi:10.1063/1.1755043
Schnars U, Jüptner W. Direct recording of holograms by a CCD target and numerical reconstruction. Appl Opt. 1994 Jan;33(2):179–81. https://doi.org/10.1364/AO.33.000179
Mitchell TM. Machine learning. 1st ed. New York: McGraw-Hill; 1997;1–421.
Scikit-learn: Machine Learning in Python [Internet]. https://scikit-learn.org
Liu R, Dey DK, Boss D, Marquet P, Javidi B. Recognition and classification of red blood cells using digital holographic microscopy and data clustering with discriminant analysis. J Opt Soc Am A Opt Image Sci Vis. 2011 Jun 1;28(6):1204-10. doi: 10.1364/JOSAA.28.001204. PMID: 21643406.
Liu R, Anand A, Dey DK, Javidi B. Entropy-based clustering of embryonic stem cells using digital holographic microscopy. J Opt Soc Am A Opt Image Sci Vis. 2014 Apr 1;31(4):677-84. doi: 10.1364/JOSAA.31.000677. PMID: 24695127.
Liu Z, Thevar T, Takahashi T, Burns N, Yamada T, Sangekar M, Lindsay D, Watson J, Thornton B. Unsupervised feature learning and clustering of particles imaged in raw holograms using an autoencoder. J Opt Soc Am A Opt Image Sci Vis. 2021 Oct 1;38(10):1570-1580. doi: 10.1364/JOSAA.424271. PMID: 34612985.
Sun Q, Liu Y, Chen H, Jiang Z. Adaptive reconstruction imaging based on K-means clustering in off-axis digital holography. Opt Continuum. 2022 Mar;1(3):475–86. https://doi.org/10.1364/OPTCON.448824
Reddy BL, Uma Mahesh RN, Nelleri A. Deep convolutional neural network for three-dimensional objects classification using off-axis digital Fresnel holography. J Mod Opt. 2022;69(13):705–17. https://doi.org/10.1080/09500340.2022.2081371
Ezugwu AE, Ikotun AM, Oyelade OO, Abualigah L, Agushaka JO, Eke CI, Akinyelu AA. A comprehensive survey of clustering algorithms: State-of-the-art machine learning applications, taxonomy, challenges, and future research prospects. Eng Appl Artif Intell. 2022;110:104743. https://doi.org/10.1016/j.engappai.2022.104743
Javidan SM, Banakar A, Vakilian KA, Ampatzidis Y. Diagnosis of grape leaf diseases using automatic K-means clustering and machine learning. Smart Agric Technol. 2023;3:100081. https://doi.org/10.1016/j.atech.2022.100081
Pitafi S, Anwar T, Sharif Z. A taxonomy of machine learning clustering algorithms, challenges, and future realms. Appl Sci. 2023;13(6):3529. https://doi.org/10.3390/app13063529
Shutaywi M, Kachouie NN. Silhouette Analysis for Performance Evaluation in Machine Learning with Applications to Clustering. Entropy (Basel). 2021 Jun 16;23(6):759. doi: 10.3390/e23060759. PMID: 34208552; PMCID: PMC8234541.
Uma Mahesh RN, Reddy BL, Nelleri A. Deep learning-based multi-class 3D objects classification using digital holographic complex images. In: Sivasubramanian A, Shastry PN, Hong PC, editors. Futuristic Communication and Network Technologies. VICFCNT 2020. Lecture Notes in Electrical Engineering, vol 792. Singapore: Springer; 2022. https://doi.org/10.1007/978-981-16-4625-6_43
Uma Mahesh RN, K B. Three-dimensional (3-D) objects classification by means of phase-only digital holographic information using Alex Network. In: 2024 International Conference on Signal Processing, Computation, Electronics, Power and Telecommunication (IConSCEPT); 2024; Karaikal, India. IEEE; 2024;1–5. doi:10.1109/IConSCEPT61884.2024.10627906
Mahesh RU, Nagaraju S. Three-dimensional (3-D) objects classification by means of phase-only digital holographic information using deep learning. In: Data Science & Exploration in Artificial Intelligence: Proceedings of the First International Conference on Data Science & Exploration in Artificial Intelligence (CODE-AI 2024); 2024 Jul 3–4; Bangalore, India. Volume 1. Boca Raton (FL): CRC Press; 2025;363. https://doi.org/10.1201/9781003587392-53


 Scan and get link