IGMIN: We're glad you're here. Please click 'create a new query' if you are a new visitor to our website and need further information from us.
If you are already a member of our network and need to keep track of any developments regarding a question you have already submitted, click 'take me to my Query.'
Welcome to IgMin Research – an Open Access journal uniting Biology, Medicine, and Engineering. We’re dedicated to advancing global knowledge and fostering collaboration across scientific fields.
At IgMin Research, we bridge the frontiers of Biology, Medicine, and Engineering to foster interdisciplinary innovation. Our expanded scope now embraces a wide spectrum of scientific disciplines, empowering global researchers to explore, contribute, and collaborate through open access.
Welcome to IgMin, a leading platform dedicated to enhancing knowledge dissemination and professional growth across multiple fields of science, technology, and the humanities. We believe in the power of open access, collaboration, and innovation. Our goal is to provide individuals and organizations with the tools they need to succeed in the global knowledge economy.
IgMin Publications Inc., Suite 102, West Hartford, CT - 06110, USA
The article presents a case study on the Investigation of lateral vibrations in the turbine-generator unit 5 of the Inga 2 hydroelectric power plant in the Democratic Republic of the Congo. Lateral vibrations were experimentally determined using twelve proximity and eddy-current probes, positioned on each measurement plane. The results were analyzed using the Dasylab and R software. Hence, it was observed that the vibration amplitudes of the upper guide bearing, lower guide bearing, and pivot/rotor exceeded acceptable or critical limit values of the international vibration standard for a rotating speed between 100-250 rpm. These excesses can lead to rotor mass imbalances, the eccentricity of the rotor axis relative to the rotation axis of the shaft, and the deformation of the coupling shaft between the upper rotor shaft and the turbine rotor shaft. Subsequently, the means and the variances of the vibration amplitudes were evaluated and compared to the reference values of the international standard. The results of the compliance analysis revealed statistically significant differences between the measured amplitudes and the reference values. Thus, it indicates deviations from international specifications.
The turbine-generator unit 5 of the Inga 2 hydroelectric power plant, which was operating at a power output close to its nominal power of 162 megawatts, presented multiple defects in its components due to overheating of the pivot. This hydroelectric unit had been in operation for 245869,02 hours without a major overhaul and had undergone a series of interventions since February 14, 2018, due to excessive overheating of the pivot. Initial investigations suggested that the excessive friction and overheating of the results were not satisfactory for a sustained period and that the excessive friction and overhearing of the pivot were due to misalignment, but the results were not satisfactory for a sustained period as the overheating persisted. Additionally, other incidents, such as misalignment detections, were not resolved.
This study aims to evaluate the lateral vibrations of the turbine-generator unit 5 of the Inga 2 hydroelectric power plant, following the last alignment correction intervention on the unit through the leveling of the cone support pivot. This study was conducted both in static and dynamic conditions, where compared to the value of the amplitude according to the international standard [11Yan ZG, Cui T, Zhou LT, Zhi FL, Wang ZW. Study on safety operation for large hydroelectric generator unit. IOP conference series: earth and environmental science. 2022; 15:2-4, discussion 3-4. DOI: 10.1088/1755-1315/15/2/02202.] and under the solicitations related to hydraulic [22Saravanja D, Grbesic M. Vibration testing for assessing the hydro unit condition in different operating modes, Proceedings of the 31st DAAAM international symposium. Published by DAAAM international. Vienne, Austria: 2020; 19-26, discussion 25. DOI: 10.2507/31st.daaam.proceedings.003.], mechanical, and electrical phenomena that occur during water intake in the penstock, rotation of the turbine, tensioning of the alternator, coupling, and load pick-up of the unit [11Yan ZG, Cui T, Zhou LT, Zhi FL, Wang ZW. Study on safety operation for large hydroelectric generator unit. IOP conference series: earth and environmental science. 2022; 15:2-4, discussion 3-4. DOI: 10.1088/1755-1315/15/2/02202.,4-104-10Shen A, Chen Y, Zhou J, Yang F, Hongliang S, Cai F. Hydraulic vibration and possible exciting sources analysis in a hydropower system. Applied science. 2021; 11: 5529-3. DOI: https://doi.org/10.3390/app11125529.]. The study also includes a conformity analysis to determine the statistically significant difference between the measured amplitude values and the international standard.
The study also includes a compliance analysis to determine statistically significant differences between the measured amplitude values and international standards. Lateral vibrations in turbine-generator groups, such as Francis turbines, play a crucial role due to their significant impact on the performance and reliability of these systems essential for electricity production. Excessive vibrations can result in premature failures of mechanical components, disrupt energy conversion, cause undesirable fluctuations in the electrical grid, and control these vibrations to optimize performance, improve equipment durability, and ensure reliable electricity production [22Saravanja D, Grbesic M. Vibration testing for assessing the hydro unit condition in different operating modes, Proceedings of the 31st DAAAM international symposium. Published by DAAAM international. Vienne, Austria: 2020; 19-26, discussion 25. DOI: 10.2507/31st.daaam.proceedings.003.,1010Mohanta RS, Chelliah TR, Allamsetty S, Akula A, Ghosh R. Sources of vibration and their treatment in hydropower stations-a review. Engineering Science and Technology, an international journal. 2016; 1-10. DOI: http://dx.doi.org/10.1016/j.jestch.2016.11.004].
The materials used in this study were twelve proximity sensors with probes that were installed and disposed of on each measurement plane as follows:
− Two displacement sensors near the upper guide bearing (GEN1 Y, GEN1 X);
− Two sensors were placed upstream AM at (0°) and the other downstream RG at (90°) on the measurement plane 01, located 200mm above the center of the upper guide bearings;
− Four sensors near the rotor-shaft turbine coupling (GEN Y, GEN X) and (GEN’ Y, GEN’ X);
− The first two sensors (GEN Y, GEN X) were placed upstream AM at (0°) and the other downstream RG at (90°) on the measurement plane 02, located at the lower rotor bracket, where the mobile guide bearing is fixed, while the other two sensors (GEN’ Y, GEN’ X) were placed upstream AM at (0°) and the other downstream RG at (90°) on the measurement plane 02’ located upstream of the bottom sump cradle point towards the turbine shaft;
− Two displacement sensors near the lower guide bearing (TURB Y, TURB X). The two sensors were placed upstream AM at (0°) and the other downstream RG at (90°) on the measurement plane 03, located 950 mm above the center of the lower guide bearings. The actual values of radial displacements at the lower guide bearing will be deduced based on this 950 mm height.
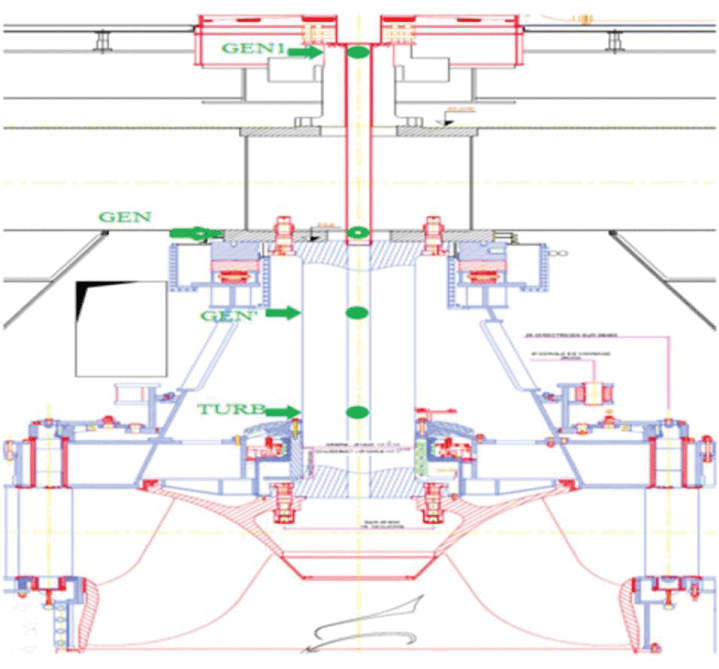
Using four measurement planes to record lateral displacements of the shaft line using proximity probes in hydroelectric group 5 (Figure 1), namely:
− Plane 01 (upper guide bearing): GEN1;
− Plane 02 (Pivot/Rotor): GEN;
− Plane 02’ (Pivot/shaft): GEN’;
− Plane 03 (lower guide bearing): TURB.
The sensors recorded signals that were analyzed using the Dasylab software, which is a data acquisition and evaluation system using a visual programming language [1212Zloto T, Pawel P, Prauzner T. Analysis of signals from inductive sensors by means of the Dasylab software. Anales UMCS informatica AX XII. 2012, 1:31-37. DOI:10.2478/v10065-0005-3.,1313Ovadia-Blechman Z, Einav S, Zaretsky U, Castel D, Toledo E, Eldar M. The area of the pressure-flow loop for assessment of arterial stenosis: a new index. Technol Health Care. 2002;10(1):39-56. PMID: 11847447.], and Microsoft Excel, using a calculator. The signal characteristics, locations, and names of the sensors recorded are detailed in Table 1.
Figure 1: Sensor location on each measurement plane [1616Consortium Siemens-Neyrpic. Commissioning report of turbine-generator unit 5. 1983; 2.2.].
Table 1: Sensor names, locations, and characteristics.
Method
In the context of collecting and analyzing data on the lateral vibrations of turbine generators, proximity sensors, and probes are installed to measure the amplitudes. The captured signals are then transmitted by the Dasylab software. The data undergoes preprocessing to eliminate errors and outliers [1313Ovadia-Blechman Z, Einav S, Zaretsky U, Castel D, Toledo E, Eldar M. The area of the pressure-flow loop for assessment of arterial stenosis: a new index. Technol Health Care. 2002;10(1):39-56. PMID: 11847447.]. Using the R software, a specific technique called conformity testing is applied. This test compares the amplitudes measured by the sensors and probes against established standards. Statistical analyses are used to evaluate the conformity of the measurements [1414Lafaya de Micheaux P, Drouilhet R, Liquet B. Software R: mastering the language of (bio) statistical analysis. Springer. 2014; 2: 1-578.]. The obtained results are interpreted to determine whether the measured amplitudes comply with the established standards.
Compliance analysis is a useful method for comparing measured data with standard values to determine the conformity or non-conformity of the data [1515Bofoya K. Statistics for economists, course and solved exercises. Kinshasa : 2010; 108-199]. In the referenced article, this method was used to assess the lateral vibrations of a turbine-generator unit by comparing the measured values with international standard values [22Saravanja D, Grbesic M. Vibration testing for assessing the hydro unit condition in different operating modes, Proceedings of the 31st DAAAM international symposium. Published by DAAAM international. Vienne, Austria: 2020; 19-26, discussion 25. DOI: 10.2507/31st.daaam.proceedings.003.] and Table 3 [11Yan ZG, Cui T, Zhou LT, Zhi FL, Wang ZW. Study on safety operation for large hydroelectric generator unit. IOP conference series: earth and environmental science. 2022; 15:2-4, discussion 3-4. DOI: 10.1088/1755-1315/15/2/02202.] at a significance level of 5% using the R software.
Through the seven start-stop cycles, dynamic vibration data was obtained, as shown in Table 2:
Table 2: Seven start-stop cycles of the turbine-generator unit 5.
Table 3: Permissible vibration values of the turbine-generator unit (double amplitude in mm).
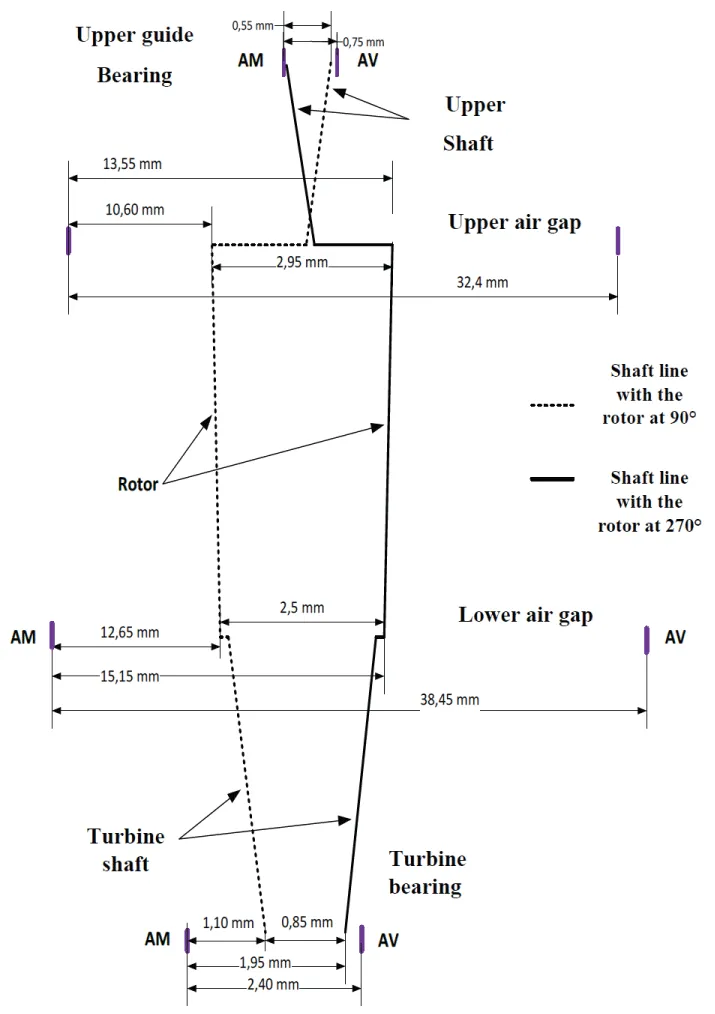
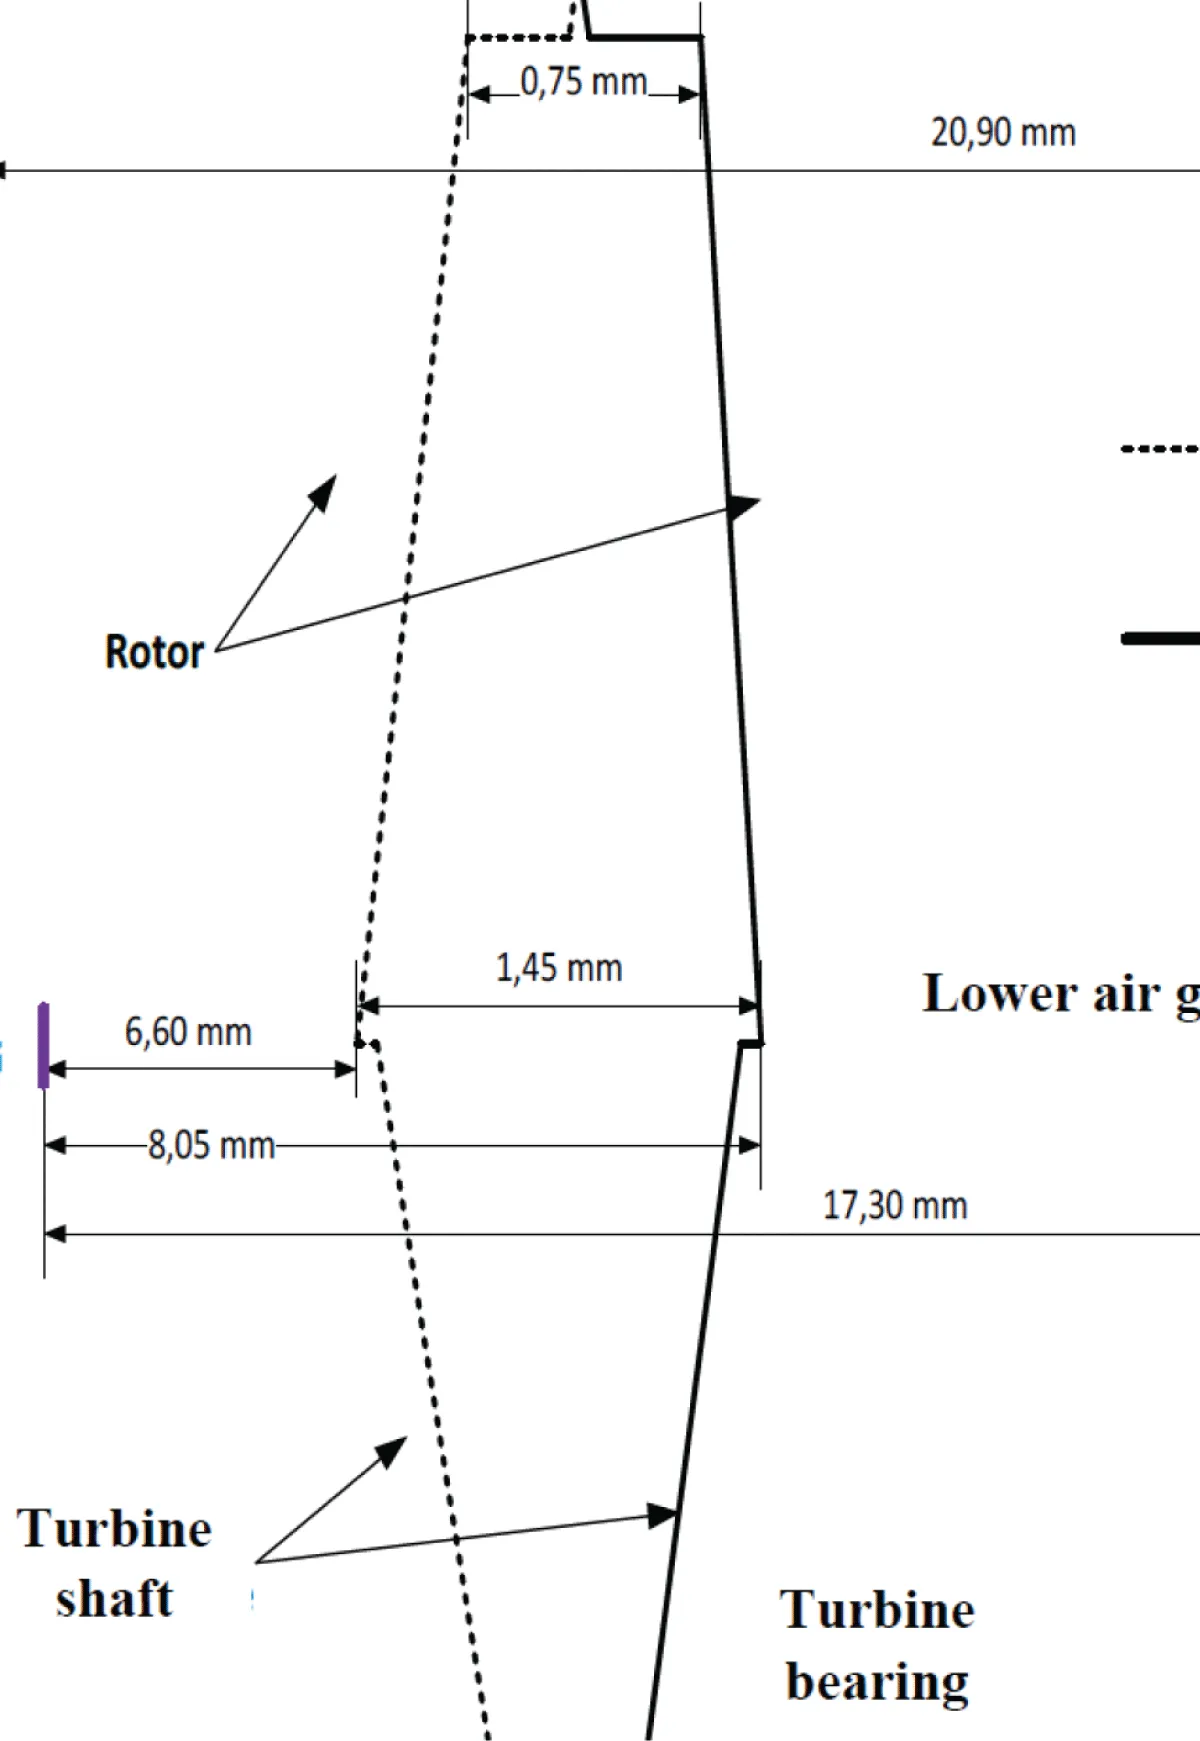
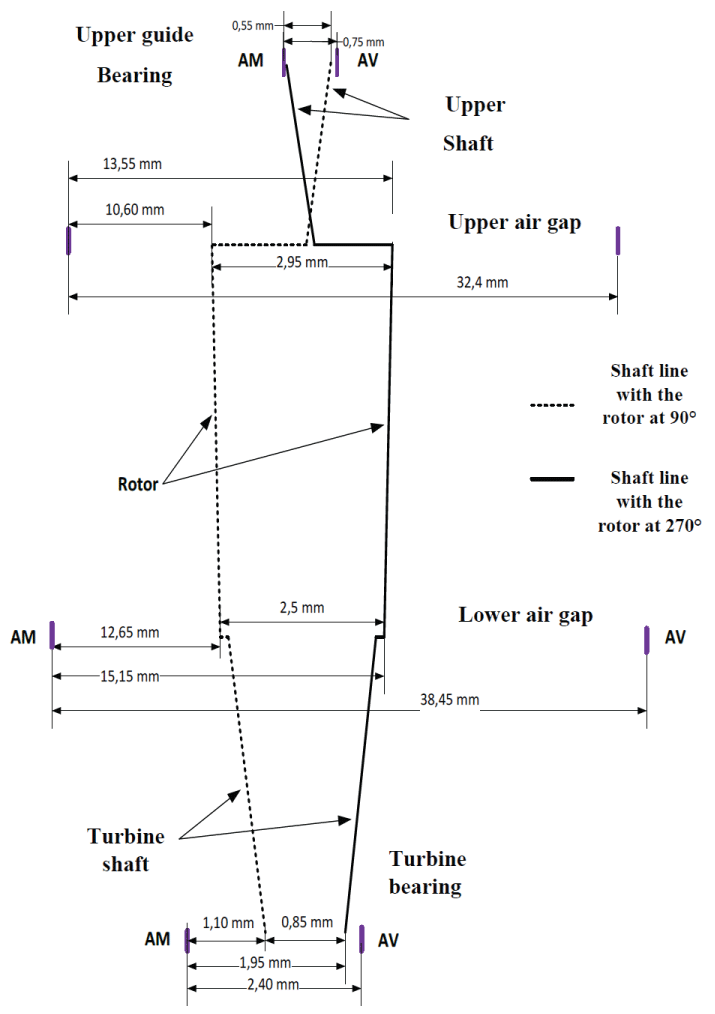
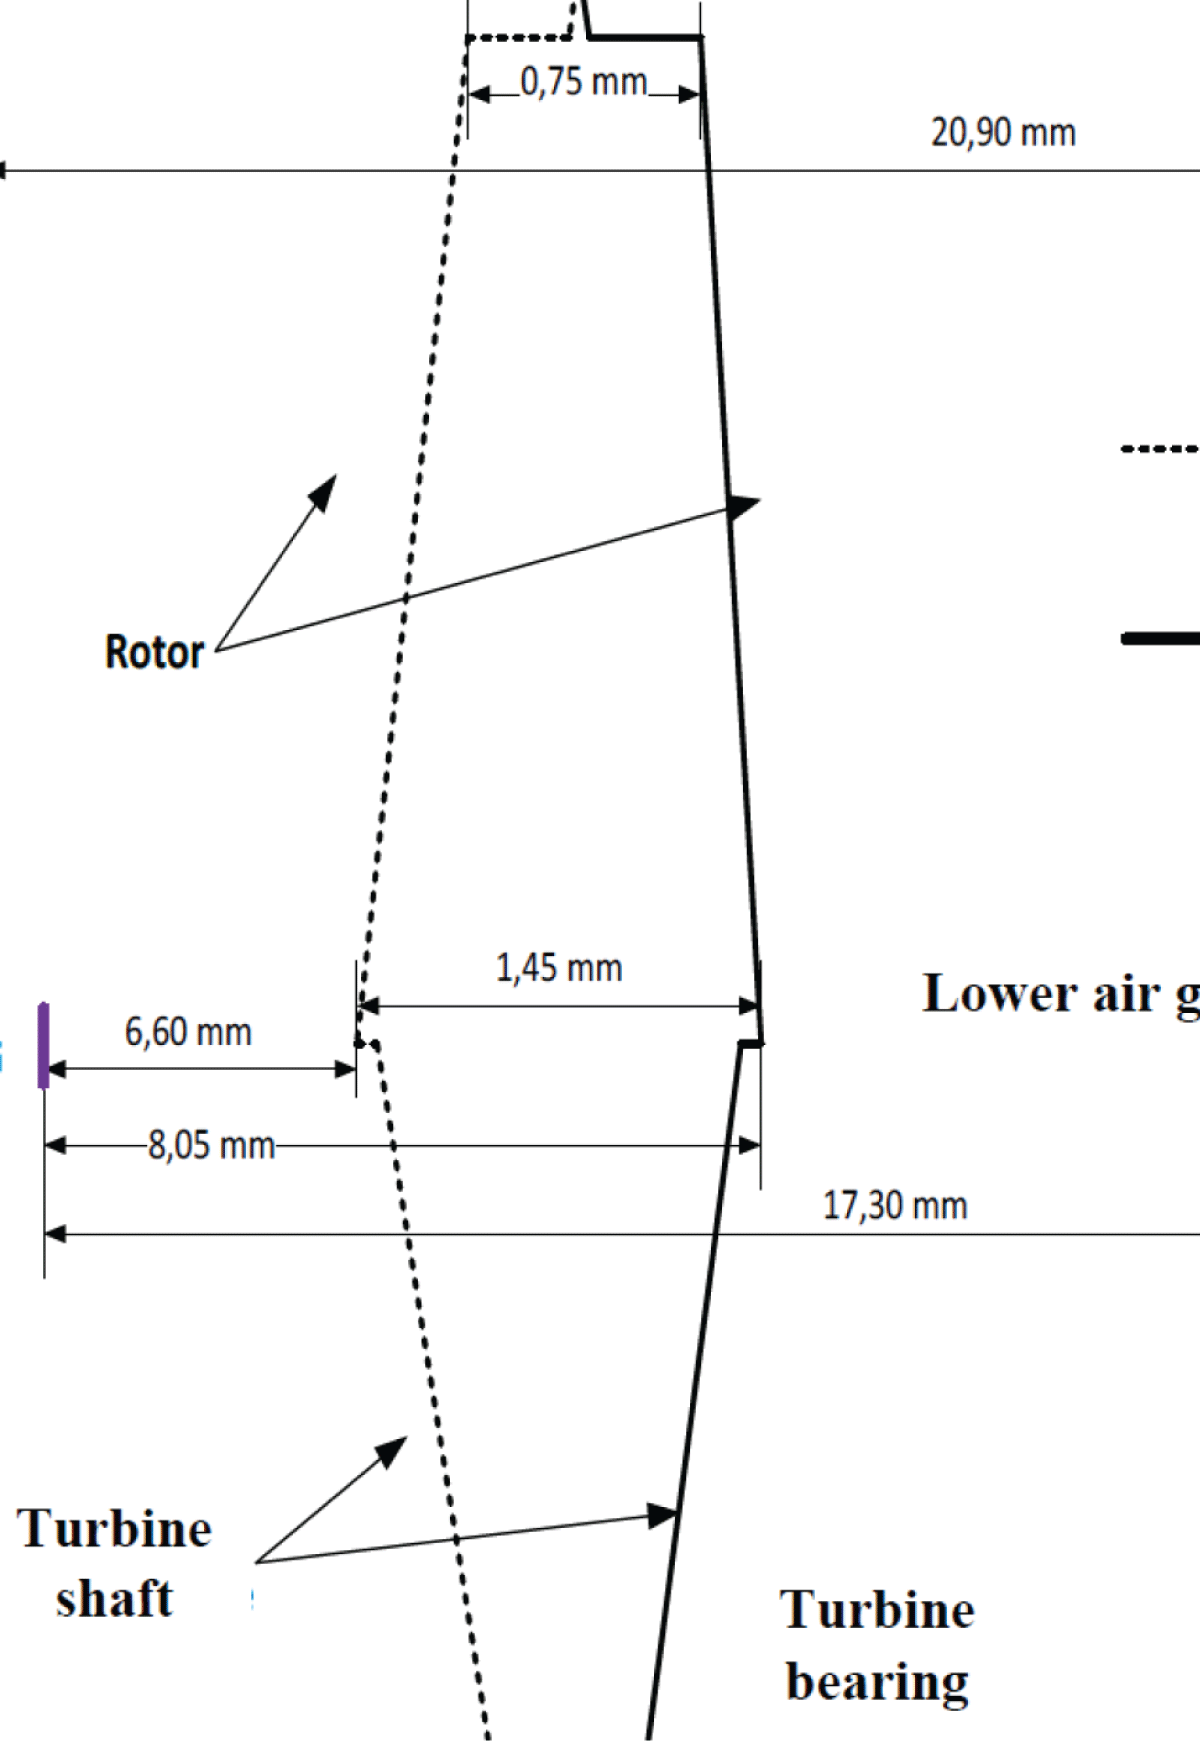
Measurements were taken in static and dynamic conditions of the shaft line of the hydro-generator unit, both in the upstream-downstream (AM-AV) and left bank-right bank (RD-RG) directions in the figures (Figures 2,3) show the shaft line at two rotor positions offset by 180°.
Based on the two presented graphs, the following phenomena were observed in the turbine-generator unit 5 at Inga 2:
− Shaft fractures in top shaft-rotor and turbine shaft-rotor couplings;
− Strong eccentricity of the rotor axis concerning the axis of rotation of the shaft line;
− On these graphs, only the minimum values recorded on each measurement plane are shown, to illustrate the most unfavorable static positions of the shaft line;
− The clearances in the guide bearings also represent the maximum lateral displacements that the shaft line will be able to perform dynamically;
− These graphs represent the section of the shaft line between the upper guide bearing and the turbine guide bearing (Figures 2,3).
Figure 2: Shaft lines along the upstream-downstream axis.
Figure 3: Shaft lines along the left bank-right bank axis.
These data, once the characteristic vibration frequency (1x) of the recorded vibration signals in static conditions, are as follows on the pivot/rotor: 3,15 mm for the x-axis, 1,45 mm for y-axis; upper rotor: 2,5 mm for x-axis, 2,00 mm for y-axis; upper guide bearing: 0,7 mm for x-axis, 0,55 mm for y-axis lower guide bearing: 0,85 mm for x-axis, 0,45 mm for y-axis. In transient conditions (star, the values are presented in Table 4 and shown in Figure 4 for the last two start-ups performed.
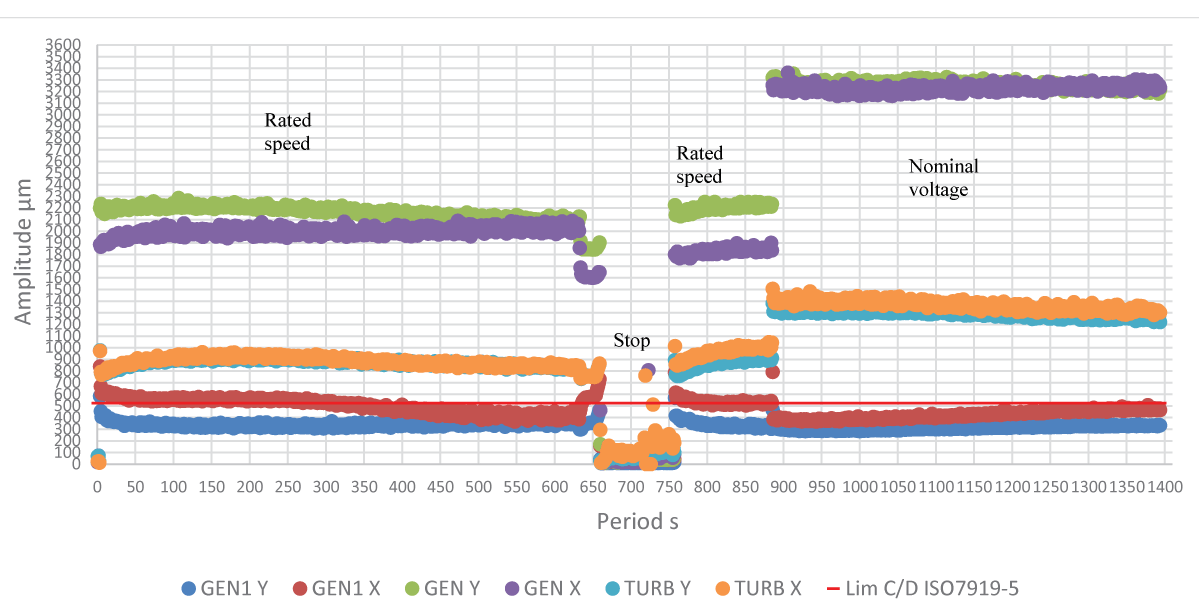
The nominal voltage stage in Figure 4 has a larger amplitude value compared to the rated speed stage.
Figure 4: Evolution (cloud) of the overall (peak-to-peak) displacement values for the last two tart-ups (06/07).
The results of the compliance analysis indicated statistically significant deviations between the measured values and the standard values at a 5% significance level and a rotational speed of 107,1 rpm [1616Consortium Siemens-Neyrpic. Commissioning report of turbine-generator unit 5. 1983; 2.2.] of the turbine generator unit 5. This indicates that the lateral vibrations exceed the specified limits in the standard in Tables 5-8.
Table 5: Amplitude value of the upper guide bearing in the x direction measured and compared to the standard in mm
Table 6: Amplitude value of the pivot/rotor in the y direction measured and compared to the standard in mm.
Table 7: Amplitude value of the lower guide bearing in the x direction measured and compared to the standard in mm.
Table 8: Amplitude value of the lower guide bearing in the y direction measured and compared to the standard in mm.
Apart from the compliance analysis that implies comparing the measured amplitude values using the Student’s t-test to the standard, the above-mentioned result follows the evaluation requirements as reported by the following researchers: [11Yan ZG, Cui T, Zhou LT, Zhi FL, Wang ZW. Study on safety operation for large hydroelectric generator unit. IOP conference series: earth and environmental science. 2022; 15:2-4, discussion 3-4. DOI: 10.1088/1755-1315/15/2/02202.] in their study on safety operation for large hydroelectric generator units in Japan They found that the double amplitudes of horizontal vibrations (0.2 mm, 0.35 mm, 0.36 mm, and 0.65 mm) and vertical vibrations (0.29 mm, 0.3 mm, 0.89 mm, and 1 mm) significantly exceed the standard, which is 0.07 mm for horizontal amplitude and 0.09 mm for vertical amplitude, at a normal speed of 100-250 rpm under all operating conditions. Also [22Saravanja D, Grbesic M. Vibration testing for assessing the hydro unit condition in different operating modes, Proceedings of the 31st DAAAM international symposium. Published by DAAAM international. Vienne, Austria: 2020; 19-26, discussion 25. DOI: 10.2507/31st.daaam.proceedings.003.] in their vibration testing for assessing the hydro unit condition in different operating modes in Austria observed that the results of vibration amplitude measurements and analysis of vibrations did not show a shape increase in vibration amplitudes compared to the guidelines on permissible vibrations of such rotary machines, which belong to the group of machines 3 ISO 10816 and according to ISO 7919-5 to the values of relative vibrations.
Firstly, the average amplitudes of the upper guide bearing along the x-axis show a deviation of 0.7 ± 0.2 mm from the allowed standard value of 0.07 mm. This significant deviation indicates substantial non-compliance and can have implications for the overall performance of the turbine. Higher amplitudes can result in excessive friction, increased temperature, and energy inefficiency. Moreover, the average amplitudes of the pivot/rotor on the x-axis exhibit a deviation of 2.31 ± 0.72 mm from the allowed value of 0.07 mm. This substantial difference may indicate serious issues of misalignment or wear in the pivot or rotor, which can affect the stability and reliability of the turbine. The average amplitudes of the lower guide bearing along the x-axis also display a deviation of 1.1 ± 0.21 mm from the permitted value of 0.07 mm. The significant deviation may suggest precision or deformation problems in the lower guide bearing, which can influence the performance and durability of the turbine. Last but not least, the average amplitudes of the lower guide bearing along the y-axis show a derivation of 1.02 ± 0.23 mm from the allowed value of 0.09 mm. This significant difference may reflect issues of misalignment or wear in the y-direction, which can affect the efficiency and safety of the turbine. These statistically significant deviations between the measured amplitudes and the standard values raise important concerns regarding the performance and compliance of the turbine-alternator group. These potential problems can lead to reduced energy efficiency, permeable component wear, an increased risk of failure, and safety issues.
The study revealed that the vibrations of the rotating turbine-generator unit 5 are excessively dangerous for the machine, both on the rotor side and the turbine guide bearing side and upper guide bearing side. The results of the compliance analysis show that the difference between the mean vibration amplitudes and the vibration standard values is statistically significant at a rotation speed of 107,1 rpm. It is necessary to stop the unit to perform a complete alignment of the fixed and movable components to restore the verticality of the turbine-generator unit axis and align the shaft line. Furthermore, the study highlighted the need to measure turbine pressure fluctuations, thermal problems, and degradation of turbine and generator elements, such as loss of elasticity in the membrane system, wear of the water wheel, bearing, and labyrinth seals, ovalization of the stator and rotor, unreliability of temperature instrumentation, and loss of sealing between the flanges and the suction cone. These issues also require urgent intervention to ensure the proper functioning and safety of the turbine-generator unit 5.
Yan ZG, Cui T, Zhou LT, Zhi FL, Wang ZW. Study on safety operation for large hydroelectric generator unit. IOP conference series: earth and environmental science. 2022; 15:2-4, discussion 3-4. DOI: 10.1088/1755-1315/15/2/02202.
Saravanja D, Grbesic M. Vibration testing for assessing the hydro unit condition in different operating modes, Proceedings of the 31st DAAAM international symposium. Published by DAAAM international. Vienne, Austria: 2020; 19-26, discussion 25. DOI: 10.2507/31st.daaam.proceedings.003.
Bawa MA, Tokan A, Salisu I. Investigation of frequent failure of Francis-hydraulic turbine guide-vane shear pin of shiroro hydro-electric power station. International journal of research publications, 2020; 57(1):44-46. DOI:10.47199/JRP100571720201326.
Shen A, Chen Y, Zhou J, Yang F, Hongliang S, Cai F. Hydraulic vibration and possible exciting sources analysis in a hydropower system. Applied science. 2021; 11: 5529-3. DOI: https://doi.org/10.3390/app11125529.
Bucur DM, Dunca G, Calinoiu C. Experimental vibration level analysis a Francis turbine. IOP conference series: earth and environmental science. 2012; 15:1-10. DOI: 10.1088/1315/15/6/062056.
Huang R, An J, Luo X, Ji B, Xu HY. Numerical simulation of pressure vibrations in a Francis turbine draft tube with air admission. Conference paper. 2014 August; 2-5. DOI: 10.1115/FEDSM2014-21444.
Zhou J, Chen Y. Discussion on stochastic analysis of hydraulic vibration in pressurized water diversion and hydropower systems. Water. 2018; 10:353-6. DOI:10.3390/w10040353.
Kim JW, Kwak WI, Choe BS, Kim HH, Suh SH, Lee YB. The rotordynamic analysis of the vibration considering the hydro-electric force supported by rolling elements in 500kW Francis turbine. Journal of mechanical science and technology. 2017; 31(11):5154-5159. DOI: 10,1007/sl2206-017-1009-0.
Lai XD, Liao GL, Zhu Y, Zhang X, Gou QQ, Zhang WB. Lateral vibration of hydro turbine-generator rotor with varying stiffness of guide bearings.IOP conference series: earth and environmental science. 2012; 15:1-15. DOI: 10.1088/1755-1315/15/4/042006.
Mohanta RS, Chelliah TR, Allamsetty S, Akula A, Ghosh R. Sources of vibration and their treatment in hydropower stations-a review. Engineering Science and Technology, an international journal. 2016; 1-10. DOI: http://dx.doi.org/10.1016/j.jestch.2016.11.004
Revue ACEC. The Inga II hydroelectric power plant. 1983; 1-32.
Zloto T, Pawel P, Prauzner T. Analysis of signals from inductive sensors by means of the Dasylab software. Anales UMCS informatica AX XII. 2012, 1:31-37. DOI:10.2478/v10065-0005-3.
Ovadia-Blechman Z, Einav S, Zaretsky U, Castel D, Toledo E, Eldar M. The area of the pressure-flow loop for assessment of arterial stenosis: a new index. Technol Health Care. 2002;10(1):39-56. PMID: 11847447.
Lafaya de Micheaux P, Drouilhet R, Liquet B. Software R: mastering the language of (bio) statistical analysis. Springer. 2014; 2: 1-578.
Bofoya K. Statistics for economists, course and solved exercises. Kinshasa : 2010; 108-199
Consortium Siemens-Neyrpic. Commissioning report of turbine-generator unit 5. 1983; 2.2.
Nzita AN, Phuati ED, Ngimbi RO, Ngoma GU, Mavungu NA. Investigation of Lateral Vibrations in Turbine-generator Unit 5 of the Inga 2 Hydroelectric Power Plant. IgMin Res. 22 Apr, 2024; 2(4): 255-260. IgMin ID: igmin173; DOI:10.61927/igmin173; Available at: igmin.link/p173
1President Joseph Kasa-Vubu University, Department of Electromechanical Engineering, Polytechnic Faculty, Boma, Kongo Central, DR Congo
2University of Kinshasa, Department of Physics, Faculty of Science and Technology, Kinshasa, DR Congo
3University of Quebec in Abitibi-Témiscamingue, School of Engineering, Rouyn-Noranda, Canada
Address Correspondence: André Mampuya Nzita, President Joseph Kasa-Vubu University, Department of Electromechanical Engineering, Polytechnic Faculty, Boma, Kongo Central, DR Congo, Email: [email protected]
How to cite this article: Nzita AN, Phuati ED, Ngimbi RO, Ngoma GU, Mavungu NA. Investigation of Lateral Vibrations in Turbine-generator Unit 5 of the Inga 2 Hydroelectric Power Plant. IgMin Res. 22 Apr, 2024; 2(4): 255-260. IgMin ID: igmin173; DOI:10.61927/igmin173; Available at: igmin.link/p173
Figure 1: Sensor location on each measurement plane [16]....
Figure 2: Shaft lines along the upstream-downstream axis....
Figure 3: Shaft lines along the left bank-right bank axis....
Figure 4: Evolution (cloud) of the overall (peak-to-peak) di...
Table 1: Sensor names, locations, and characteristics....
Table 2: Seven start-stop cycles of the turbine-generator u...
Table 3: Permissible vibration values of the turbine-genera...
Table 4: Summary of the second series of recordings (start-...
Table 5: Amplitude value of the upper guide bearing in the ...
Table 6: Amplitude value of the pivot/rotor in the y direct...
Table 7: Amplitude value of the lower guide bearing in the ...
Table 8: Amplitude value of the lower guide bearing in the ...
Yan ZG, Cui T, Zhou LT, Zhi FL, Wang ZW. Study on safety operation for large hydroelectric generator unit. IOP conference series: earth and environmental science. 2022; 15:2-4, discussion 3-4. DOI: 10.1088/1755-1315/15/2/02202.
Saravanja D, Grbesic M. Vibration testing for assessing the hydro unit condition in different operating modes, Proceedings of the 31st DAAAM international symposium. Published by DAAAM international. Vienne, Austria: 2020; 19-26, discussion 25. DOI: 10.2507/31st.daaam.proceedings.003.
Bawa MA, Tokan A, Salisu I. Investigation of frequent failure of Francis-hydraulic turbine guide-vane shear pin of shiroro hydro-electric power station. International journal of research publications, 2020; 57(1):44-46. DOI:10.47199/JRP100571720201326.
Shen A, Chen Y, Zhou J, Yang F, Hongliang S, Cai F. Hydraulic vibration and possible exciting sources analysis in a hydropower system. Applied science. 2021; 11: 5529-3. DOI: https://doi.org/10.3390/app11125529.
Bucur DM, Dunca G, Calinoiu C. Experimental vibration level analysis a Francis turbine. IOP conference series: earth and environmental science. 2012; 15:1-10. DOI: 10.1088/1315/15/6/062056.
Huang R, An J, Luo X, Ji B, Xu HY. Numerical simulation of pressure vibrations in a Francis turbine draft tube with air admission. Conference paper. 2014 August; 2-5. DOI: 10.1115/FEDSM2014-21444.
Zhou J, Chen Y. Discussion on stochastic analysis of hydraulic vibration in pressurized water diversion and hydropower systems. Water. 2018; 10:353-6. DOI:10.3390/w10040353.
Kim JW, Kwak WI, Choe BS, Kim HH, Suh SH, Lee YB. The rotordynamic analysis of the vibration considering the hydro-electric force supported by rolling elements in 500kW Francis turbine. Journal of mechanical science and technology. 2017; 31(11):5154-5159. DOI: 10,1007/sl2206-017-1009-0.
Lai XD, Liao GL, Zhu Y, Zhang X, Gou QQ, Zhang WB. Lateral vibration of hydro turbine-generator rotor with varying stiffness of guide bearings.IOP conference series: earth and environmental science. 2012; 15:1-15. DOI: 10.1088/1755-1315/15/4/042006.
Mohanta RS, Chelliah TR, Allamsetty S, Akula A, Ghosh R. Sources of vibration and their treatment in hydropower stations-a review. Engineering Science and Technology, an international journal. 2016; 1-10. DOI: http://dx.doi.org/10.1016/j.jestch.2016.11.004
Revue ACEC. The Inga II hydroelectric power plant. 1983; 1-32.
Zloto T, Pawel P, Prauzner T. Analysis of signals from inductive sensors by means of the Dasylab software. Anales UMCS informatica AX XII. 2012, 1:31-37. DOI:10.2478/v10065-0005-3.
Ovadia-Blechman Z, Einav S, Zaretsky U, Castel D, Toledo E, Eldar M. The area of the pressure-flow loop for assessment of arterial stenosis: a new index. Technol Health Care. 2002;10(1):39-56. PMID: 11847447.
Lafaya de Micheaux P, Drouilhet R, Liquet B. Software R: mastering the language of (bio) statistical analysis. Springer. 2014; 2: 1-578.
Bofoya K. Statistics for economists, course and solved exercises. Kinshasa : 2010; 108-199
Consortium Siemens-Neyrpic. Commissioning report of turbine-generator unit 5. 1983; 2.2.


 Scan and get link


![Sensor location on each measurement plane [16].](https://www.igminresearch.com/articles/figures/igmin173/igmin173.g001.webp)