IGMIN: We're glad you're here. Please click 'create a new query' if you are a new visitor to our website and need further information from us.
If you are already a member of our network and need to keep track of any developments regarding a question you have already submitted, click 'take me to my Query.'
Welcome to IgMin Research – an Open Access journal uniting Biology, Medicine, and Engineering. We’re dedicated to advancing global knowledge and fostering collaboration across scientific fields.
At IgMin Research, we bridge the frontiers of Biology, Medicine, and Engineering to foster interdisciplinary innovation. Our expanded scope now embraces a wide spectrum of scientific disciplines, empowering global researchers to explore, contribute, and collaborate through open access.
Welcome to IgMin, a leading platform dedicated to enhancing knowledge dissemination and professional growth across multiple fields of science, technology, and the humanities. We believe in the power of open access, collaboration, and innovation. Our goal is to provide individuals and organizations with the tools they need to succeed in the global knowledge economy.
IgMin Publications Inc., Suite 102, West Hartford, CT - 06110, USA
Economists often provide predictions about future interest or policy rates. In contrast to stock market predictions, these forecasts are typically regarded seriously and presented with a degree of accuracy. This paper explores whether placing more confidence in policy rate predictions than stock market predictions is reasonable. It begins by examining historical policy rates predictions in Sweden, comparing them to actual rates to assess their accuracy. The paper then delves into the discussion of how costs of mispredictions, such as sudden and unexpected policy rate increases, can and should be addressed. Despite the Central Bank making predictions within confidence intervals and the banking sector regulating individuals’ borrowing, the burden of unpredicted rate increases falls almost entirely on individuals. The paper addresses whether that is reasonable.
Economists commonly make predictions about the future, and for many economists and institutions, making predictions is their main task. For instance, macroeconomists commonly predict, and are quoted on, the rate at which the economy will grow, whether interest rates are going up or down by how much, and what will happen to unemployment and inflation. Central Banks make policy rate predictions and present different scenarios with varying degrees of accuracy. Journalists and people give these predictions considerable attention and seem to place some trust in them.
That the predictions get attention and are referred to is not strange, as most people are affected by future interest rates or how the economy, in general, is developing. In order to make sensible investment and savings decisions, both individuals and firms need to have a sense of how future interest rates will develop.
Recently, due to the sudden and unexpected increase in interest rates, the consequences of higher interest rates for individuals, firms, and the overall economy have been addressed. Most economists predicted that interest rates would remain low for the foreseeable future. As mispredictions, both over- and underpredictions, from actual rates can have major impacts on households’ and firms’ finances and investment decisions, it becomes relevant to discuss who should carry the cost or risk with mispredictions. That is, who should be accountable when forecasts are off the mark? The Central Bank in Sweden publishes predictions of future policy rates five times annually. The predicted rates are presented with three different levels of confidence: 50, 75 and 90%, suggesting that they are presented with some kind of accuracy.
Individuals and households in Sweden that want to borrow face several restrictions and regulations limiting who can borrow and how much. Private banks granting loans are regulated, and there are several restrictions regulating who and how much an individual/household can borrow. For instance, the maximum amount that can be borrowed with the home as security is 85% of the value of the home. Loans that exceed 50% of the home value need to be amortized by either one or 2% of the loan annually. On top of that, households with loans exceeding 450% of gross income need to pay off an additional 1% of the loan annually. Before granting private loans, banks make sure that households have enough to live on by calculating the required amount left to live on, taking into account a higher interest rate. Is it still reasonable to put all risk on individuals and households when they meet all the regulations and put faith in the predictions that the central bank makes?
Individuals and households in Sweden that want to borrow meet several restrictions and regulations limiting who can borrow and how much. Private banks granting loans are regulated and there are several restrictions regulating who and how much an individual/household can borrow. For instance, the maximum amount that can be borrowed with the home as security is 85% of the value of the home, loans that exceed 50% of the home value need to be amortized by either one or 2% of the loan annually. On top of that, households with loans exceeding 450% of gross income need to pay off an additional 1% of the loan annually. Before granting private loans, banks make sure that households have enough to live on by calculating the required amount left to live on, taking height for a higher interest rate. Is it still reasonable to put all risk on individuals and households when they meet all the regulations and put faith in the predictions that the central bank makes?
This paper starts by discussing whether there are reasons to believe that macroeconomic predictions are more reliable than stock price predictions. A large part of the paper analyzes how accurate policy rate predictions have been in Sweden. Forecasts of Swedish policy rates made by the Swedish Central Bank are compared to actual policy rates in an attempt to determine how well the forecasts correspond to actual rates and whether there is any pattern in mispredictions over time.
Finally, as the consequences of mispredictions can be severe, the paper discusses who is best suited to carry the risks and costs of mispredictions. Currently, private individuals carry almost the entire risk. Is it reasonable that individuals themselves are responsible, or should the Central Bank, private banks, or the government (taxpayers) carry some of the responsibility?
The more general issues discussed in the paper address the important aspects of risk-taking and risk-sharing. As the level of uncertainty is increasing in the economy, due to the geopolitical situations, new technology, climate change, possible future pandemics, or other crises it is of great importance to discuss and determine who is best suitable to bear risks. The paper focuses on interest rate uncertainty but could be generalized to cover other types of risks as well. In order to address the questions raised in the paper, the Efficient Market Hypothesis (EMH) and the theory of the superior insurer are employed. Additionally, the empirical part tests the accuracy of the predictions using data from the Swedish Central Bank covering an extensive period of time.
Are policy rate predictions more trustworthy and informative than stock price predictions?
The sudden increase in interest rates took many by surprise and was not in line with predictions. One commonly expressed argument for why the policy rates would remain low for the foreseeable future was that the rates had been low for a long time and, hence, would continue to be low. This is an interesting argument, as economists commonly criticize investment bankers for predicting stock prices based on historical stock prices, a practice typically referred to as technical analysis—a methodology most academic researchers don’t believe to be useful as a predictor for future prices. Empirical research tends to support the notion that technical analysis performs poorly [11Sewell M. The Efficient Market Hypothesis: Empirical Evidence, International Journal of Statistics and Probability. 2012; 2.]. Why, then, would we trust macro predictions based on historical data when we don’t trust financial predictions based on historical data?
To be fair, economists do not only look at historical data but also incorporate other information into their prediction models. For example, demographic development, technological changes, savings behavior, and changes in world demand and supply are considered as well. But, once again, economists in general do not believe that this type of analysis, referred to as fundamental analysis, works well when it comes to predicting stock prices. The reason for economists’ lack of faith in fundamental analysis is that the market is assumed to be efficient, and all available information is already accounted for in existing prices. Hence, predicting stock prices based on available information is considered useless, as changes in stock prices only reflect unexpected new information.
The idea that stock prices are hard to predict extends far back in time. Perhaps the most well-known advocate for this is Eugene Fama [22Fama E. Efficient Capital Markets: A Review of Theory and Empirical Work. Journal of Finance. 1970; 25(2): 383-417.] and his hypothesis about market efficiency. The Efficient Market Hypothesis (EMH) is a well-known theory within financial economics and was rewarded with a Nobel Prize in Economics in 1993, along with a major opponent of the EMH, Robert Schiller.
EMH claims that stock prices are hard to predict using available information, as this information has already been incorporated into stock prices. There are three levels of market efficiencies associated with different levels of information incorporated in the price. If the market meets the lowest level of efficiency, weak efficiency, stock prices cannot be predicted using historical data or technical analysis. The reason for this is that this information has already been used and incorporated into stock prices. This implies that an investor cannot consistently make abnormal profits, profits above the risk compensation, based on investment decisions using information about how well stocks performed historically, as this information is already priced in. The next level of efficiency is semi-strong efficiency; the market is said to be semi-strong efficient if all publicly available information is also incorporated into stock prices. If this is the case, fundamental analysis, where all available public information is used to predict future stock prices, is fruitless. Finally, if the market exhibits strong efficiency, private information (inside information) cannot be used to predict future stock prices.
Empirical tests of the Efficient Market Hypothesis (EMH) have been conducted using various methods and data sources, aiming to examine whether financial markets exhibit the levels of efficiency proposed by the EMH. It’s important to note that the results of these tests are not universally consistent, and ongoing debate persists in the academic literature. There is considerable consensus that the market does not meet a strong level of efficiency; inside information can be used to make abnormal profits. In general, and perhaps not surprisingly, academics are more inclined to believe in the EMH than practitioners. According to the former, the market seems to be somewhere between weak and semi-strong efficiency [33Byström H. Finance: Markets, instruments and investments, Student Literature. 2020.], but the last word on this matter is far from said.
Regardless of the relevance of the EMH, there seems to be a mismatch in the faith economists place in financial actors predicting stock prices and macroeconomists predicting future policy rates. Is there any reason to put more faith in policy rate predictions than in stock price predictions? There are several similarities between the two types of predictions, but also important differences that may explain why they differ.
One similarity is that future rates, both stock prices and policy rates, seem to be affected by sudden and unpredictable events. Inflation rates, and hence policy rates, changed drastically during the financial crisis, the COVID-19 pandemic, and the invasion of Ukraine—events that were hard to predict but had major impacts on both the stock market and policy rates. According to the EMH, stock prices are impacted by sudden and unpredictable events that, hence, could not already be accounted for in current prices. Jumping ahead, results presented later in the paper show that forecasts were particularly off predicting rates in turbulent times.
Another similarity is that both stock prices and future interest rates are determined by psychological factors and beliefs about future prices. If future beliefs can be influenced, then future prices will also be affected. For instance, predicting future policy rates can be self-fulfilling. Interest rates are naturally linked to inflation, as the target is to keep inflation within a range of around 2% and the policy rate is the main instrument used to fulfill this aim. Central banks try to influence future inflation by convincingly demonstrating that they can lower the inflation rate and will do what is in their power to ensure inflation falls within its target range. If central banks are convincing in reaching their target, individuals will not ask for compensation for inflation, e.g., higher wages. But if inflation is believed to be a long-run problem, individuals will demand compensation (higher wages) and then fuel an inflation spiral. To prevent this from happening, central banks try to convincingly show that they will do whatever is in their power to meet the goal. If central banks have credibility in reaching the target, they may have more power to impact future interest rates. This is similar to financial assets, as these are valued by discounted future cash flows. This affects future beliefs about cash flows and, hence, impacts current stock prices.
Stock market predictions differ from policy rate predictions in that they are made by millions of different actors (basically everybody who participates in the market), and it is their very aim to find mispriced assets, and thereby make the market efficient. Hence, it is only unexpected new information that will lead to unexpected developments in prices, and hence, the ability to make excess profit. The EMH assumes that mispriced stocks are detected and taken advantage of quickly for them to vanish. This is not the case for inflation. Inflation is often caused by external events (changes in demand or supply), and even if future inflation can be affected by inflation expectations that central banks influence, the link between the central banks’ actions and future inflation is weaker than the link between financial actors and stock prices.
To sum up, even with several similarities between different types of predictions, inflation or interest rates are probably, in theory, easier to predict than future stock prices, making central banks better equipped to predict future policy rates. Let’s now turn to see how well the Swedish Central Bank has predicted future policy rates.
Policy rate forecasts in Sweden
The Swedish Central Bank, Riksbanken, publishes five reports annually presenting predictions for future policy rates. These forecasts garner significant attention in the media and among economists. This section compares these forecasts to actual policy rates to assess their historical accuracy. The period studied is extensive, covering 2008 to the present and the data hand hand-collected from the five reports annually.
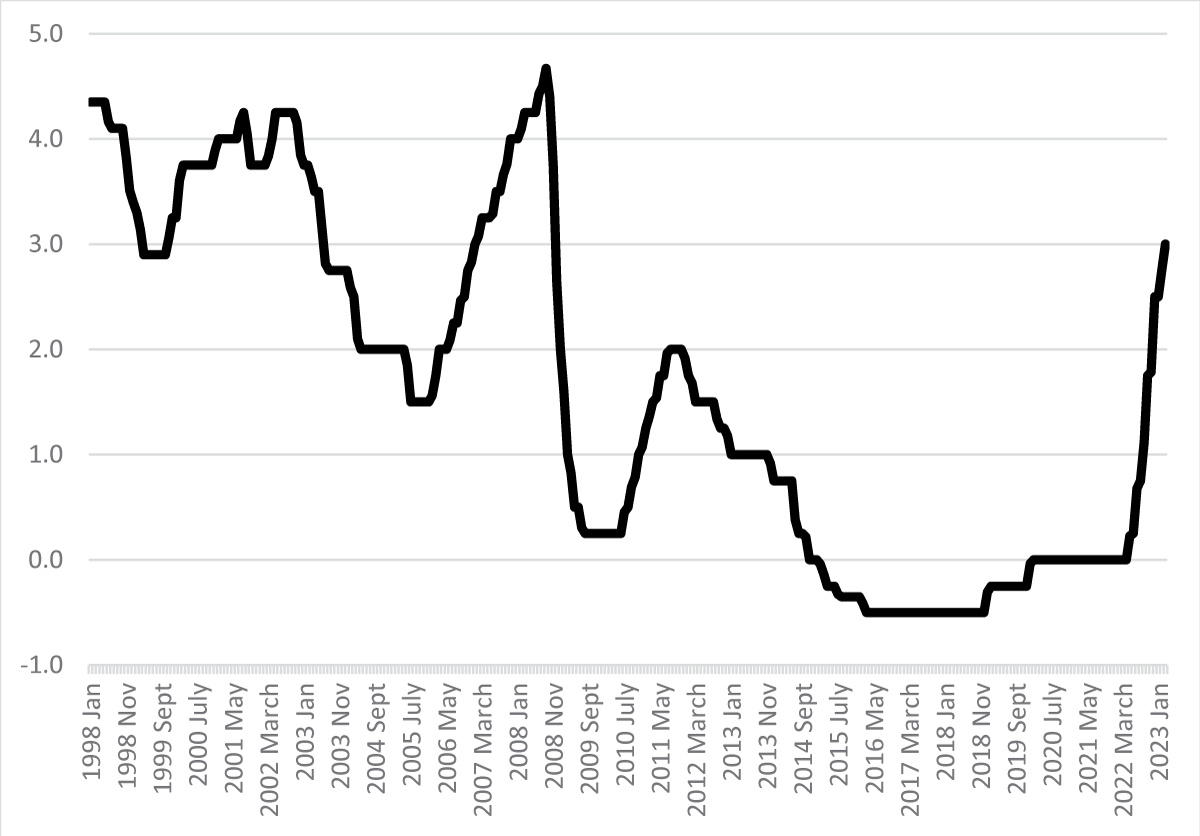
Figure 1 illustrates the mean monthly policy rates set by the Central Bank from 1998 to 2023. Throughout this period, there has been substantial variation in policy rates. Between 1998 and 2002, rates hovered around three to 4%. Subsequently, they declined, reaching a low of 1.5% in 2005. Following this dip, rates surged, peaking at 4.67% in September 2008. The financial crises in 2008 prompted a sharp rate decrease, with rates at 0.25% for nearly a year before rising to 2% in 2011. Since 2011, policy rates have witnessed a significant decline, reaching historically low levels, and even dipping into negative territory for a substantial period. However, in late 2022, another noteworthy development occurred, marked by a sharp increase in rates. As of February 2023, the Central Bank’s policy rate stands at 2.75%.
Figure 1: Mean monthly Central Bank policy rates in Sweden, 1998-2022. Source: Monetary Policy Report, Riksbanken [44The Riksbank (2023). Monetary policy report, various reports, https://www.riksbank.se/sv/press-och-publicerat/publikationer/penningpolitisk-rapport/].
During this period, policy rates have exhibited considerable variation. The rate peaked in 2009 at 4.67 and dipped to -0.25, a range of nearly 5% points.
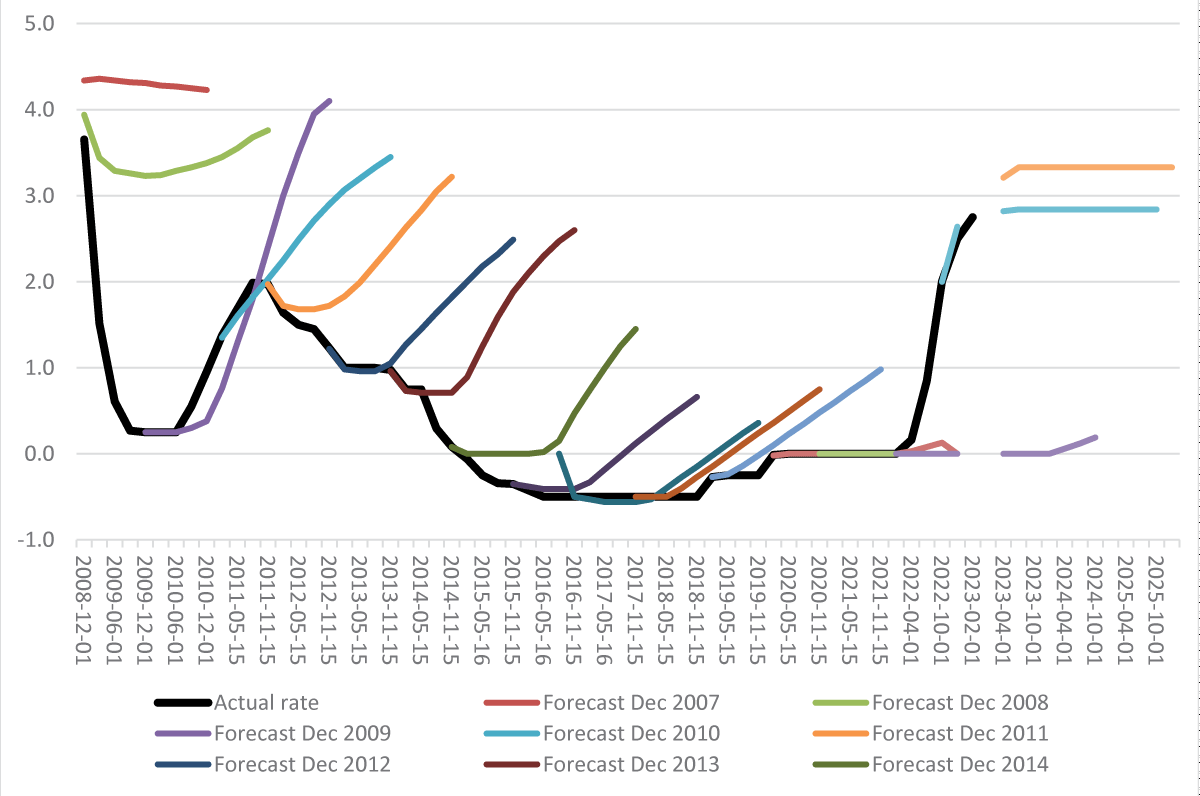
How accurately have these policy rates been forecasted by the Central Bank? Figure 2 contrasts the actual policy rates (the bold black line) with the forecasted rates presented in Monetary Policy Reports published between Dec 2007 and Feb 2023. The differently colored lines represent policy rate forecasts presented at different times. For instance, the yellow line represents forecasts presented in Dec 2009 and shows the forecast for Dec 2009 was accurate but became increasingly inaccurate for forecasts future in time.
Figure 2: Actual policy rates and rates forecasted at various times, 2008 to 2025. Source: Monetary Policy Report, Riksbanken [44The Riksbank (2023). Monetary policy report, various reports, https://www.riksbank.se/sv/press-och-publicerat/publikationer/penningpolitisk-rapport/].
As observed in the figure, forecasts have deviated remarkably. They do not align with actual rates (the bold black line) and show an increasing deviation for predictions further into the future. It’s not surprising that forecasts are more accurate for the near future compared to more distant periods. However, the forecasts seem to quickly diverge from actual rates. Forecasts can be inaccurate in both directions—overestimating or underestimating the future rate. Forecasts above the bold black line overestimate future policy rates, while those below underestimate future policy rates. During the period from 2009 to 2022, forecasts consistently overestimated future rates, with exceptions in December 2019 and December 2021, when predicted rates were underestimations compared to actual rates. Overall, forecasts rarely align with actual rates.
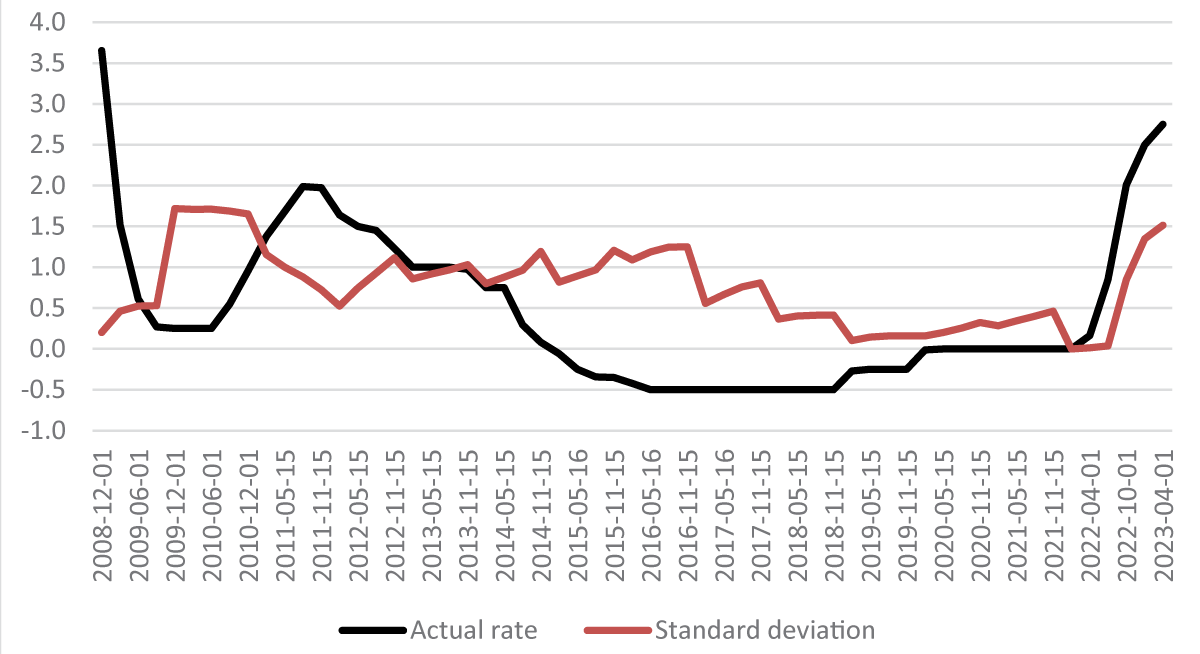
Figure 3 presents the mispredictions in forecasts, measured as the standard deviation between the predicted rate (from different forecasts) and the true rate at a specific time. The higher the standard deviation, the more inaccurate the predictions are compared to actual policy rates at that time. Forecasts performed best in predicting rates during the period 2018 to 2022 when the standard deviation was below 0.5. This period coincided with actual policy rates being negative or zero. Forecasts were particularly imprecise in predicting policy rates between 2009 and 2010 and in 2023—after the financial crisis and before the inflation hike in 2022- particularly imprecise in predicting policy rates between 2009 and 2010 and in 2023—after the financial crisis and before the inflation hike in 2022.
Figure 3: Actual policy rate at different times and the size of mispredictions at that time Source: Monetary Policy Report, Riksbanken [44The Riksbank (2023). Monetary policy report, various reports, https://www.riksbank.se/sv/press-och-publicerat/publikationer/penningpolitisk-rapport/].
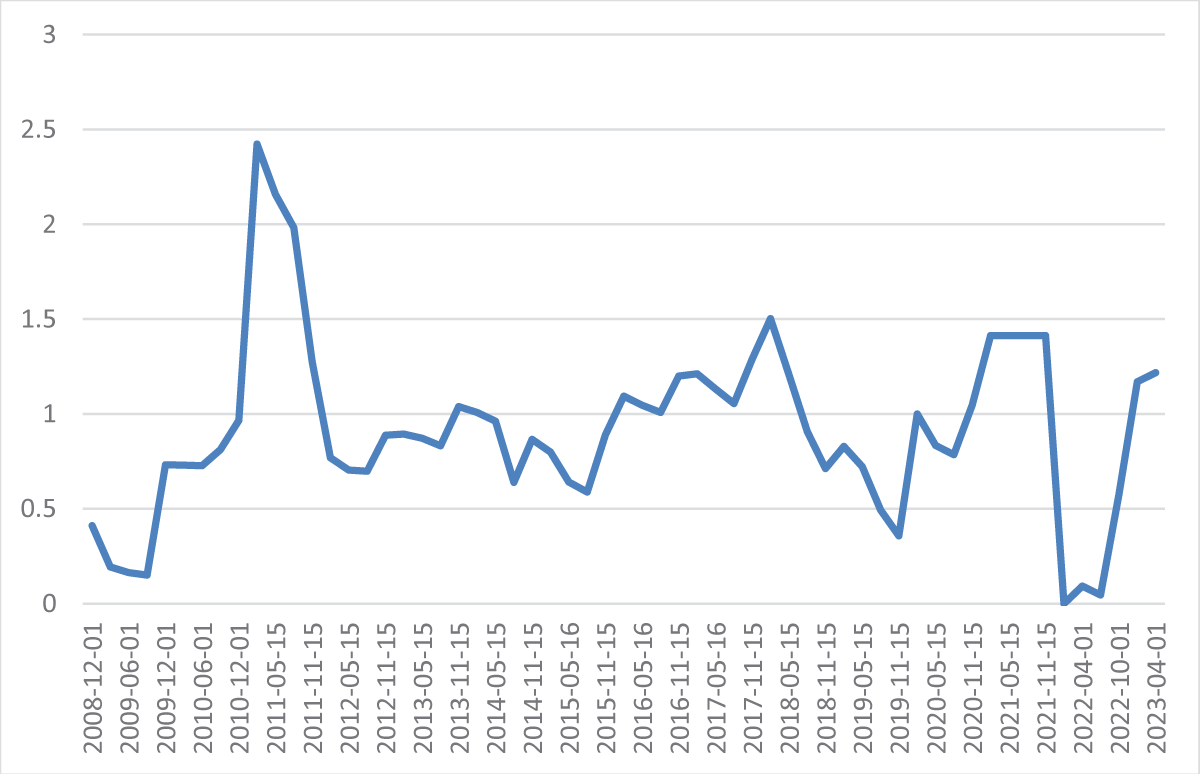
To gauge the magnitude of deviations between predictions and actual rates, the coefficient of variation can be used. The coefficient of variation sets the standard deviation in relation to the mean of the variable (that is, the standard deviation is divided by the mean). A coefficient of variation above one is typically considered high. Figure 4 shows the coefficient of variation of predictions of policy rates over time. The coefficient of variation was commonly above or close to one. Policy rate predictions for the years 2011, 2013, 2016-2018, and 2023 were above one, with rates in 2011 particularly off the mark.
Figure 4: Coefficient of variation of predicting policy rates, 2008-2023. Source: Monetary Policy Report, Riksbanken [44The Riksbank (2023). Monetary policy report, various reports, https://www.riksbank.se/sv/press-och-publicerat/publikationer/penningpolitisk-rapport/].
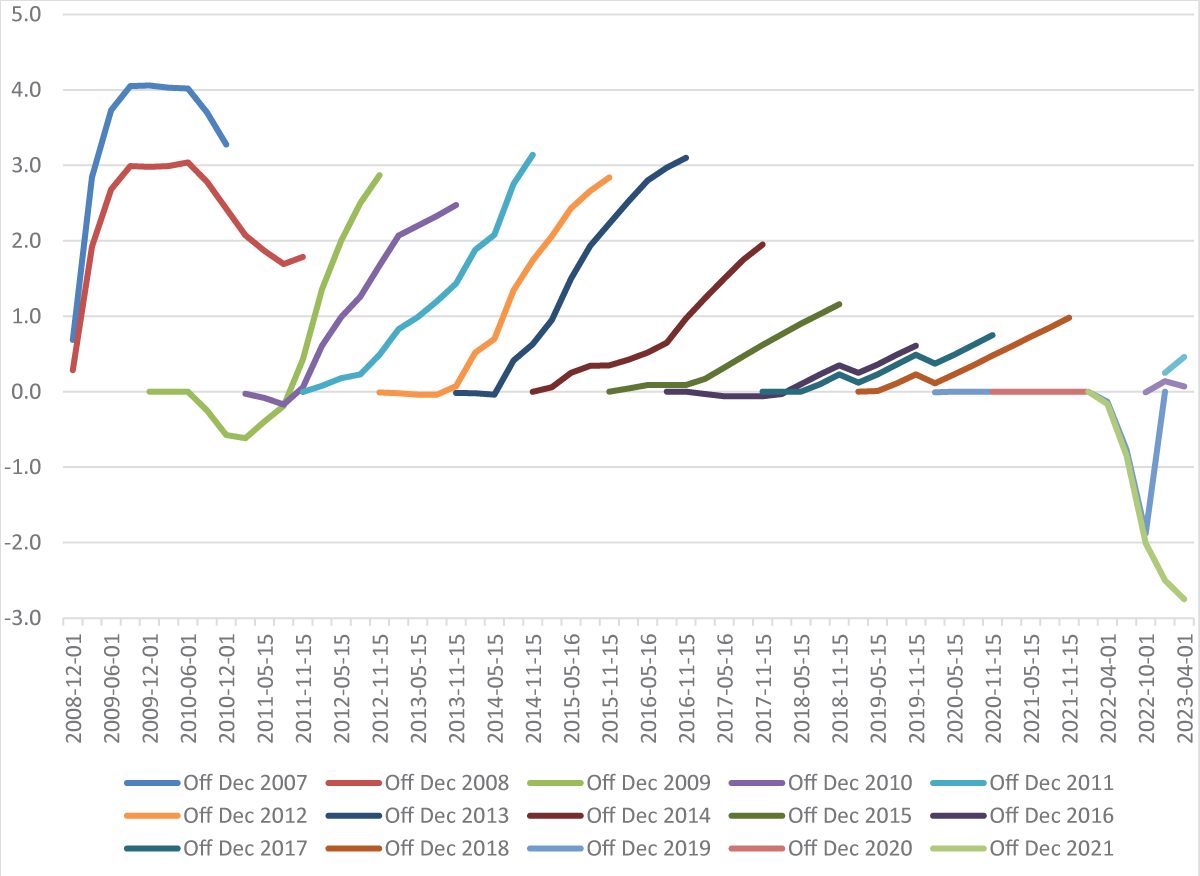
So far, we’ve examined how well forecasts have predicted future rates; now, we turn to investigate how well predictions made at different times have performed. Figure 5 illustrates the percentage point difference between forecasted policy rates presented at different times and actual policy rates. For instance, forecasts made in Dec 2007 illustrated by the blue line named “Off Dec 2007” shows how many percentage points forecasts made in Dec 2007 were off from the actual rate, for Dec 2018 the forecast was off 1% point, while forecasts for 2009 were off by 4% points.
Figure 5: Forecast deviations from actual rates, forecasts between 2007 to 2023, percentage points. Source: Monetary Policy Report, Riksbanken [44The Riksbank (2023). Monetary policy report, various reports, https://www.riksbank.se/sv/press-och-publicerat/publikationer/penningpolitisk-rapport/].
Forecasts are commonly inaccurate, and during the studied period, overestimations were more prevalent than underestimations. In general, forecasts made during the period from 2009 to 2013 were off by around 3% points, with several forecasts presented in December 2007 deviating by as much as 4% points. Forecasts made in the period 2014 to 2018 deviated less from actual rates, and estimates done in 2021 underestimated future rates. The forecast published in December 2021 predicted an almost 3% points lower policy rate than the actual rate.
The pattern appears to be that forecasts have improved over time, with the exception of 2021. From Figure 5, it seems that forecasts presented between 2014 and 2019 were those that predicted future policy rates with the best accuracy.
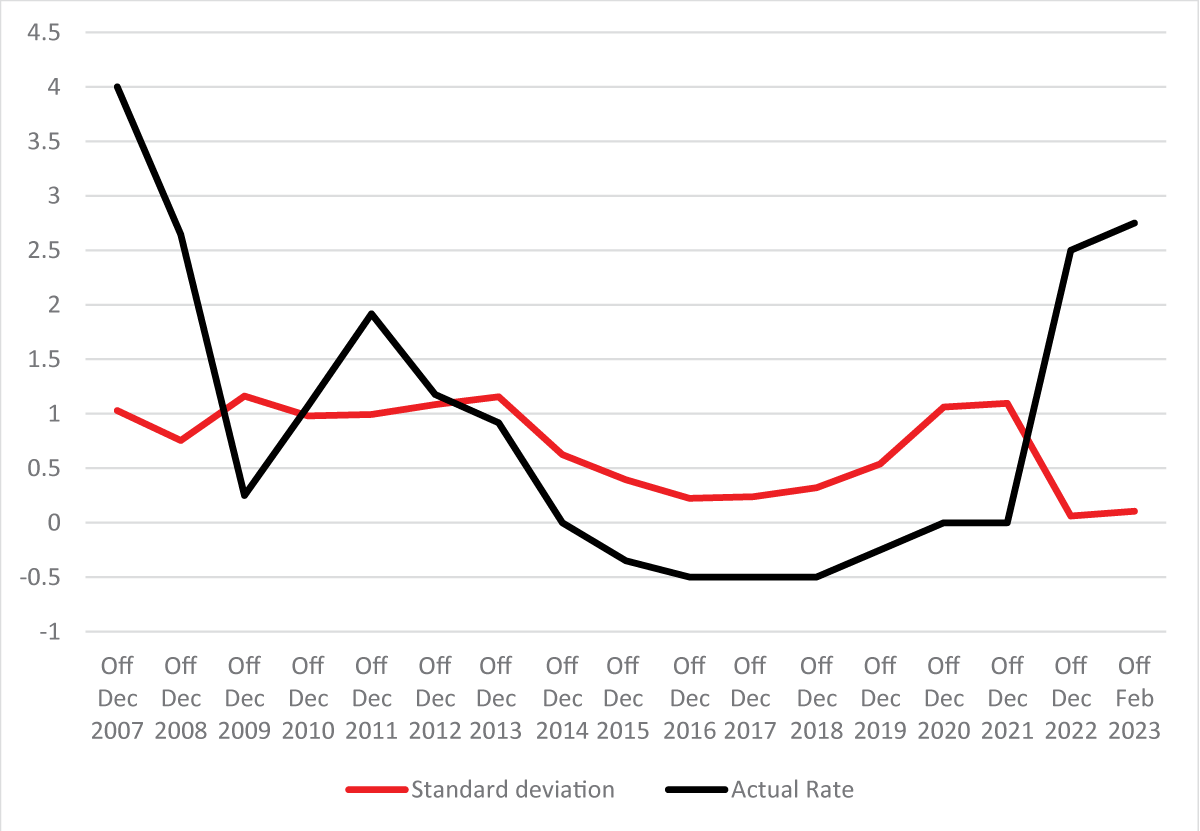
Figures 6,7 present the standard deviation and the coefficient of variation in forecasts, respectively. Standard deviations of forecasts presented between 2014 and 2019 were low. Standard deviations were high for predictions published between 2008 and 2013, and then again in 2020 and 2021. Not surprisingly, forecasts made in turbulent years seem to be more off than predictions made during more stable years.
Figure 6: Accuracy, measured as standard deviation, for different forecasts, 2007 to 2023. Source: Monetary Policy Report, Riksbanken [44The Riksbank (2023). Monetary policy report, various reports, https://www.riksbank.se/sv/press-och-publicerat/publikationer/penningpolitisk-rapport/].
Figure 7: Coefficient of variation for various predictions, 2007 to 2023. Source: Monetary Policy Report, Riksbanken [44The Riksbank (2023). Monetary policy report, various reports, https://www.riksbank.se/sv/press-och-publicerat/publikationer/penningpolitisk-rapport/].
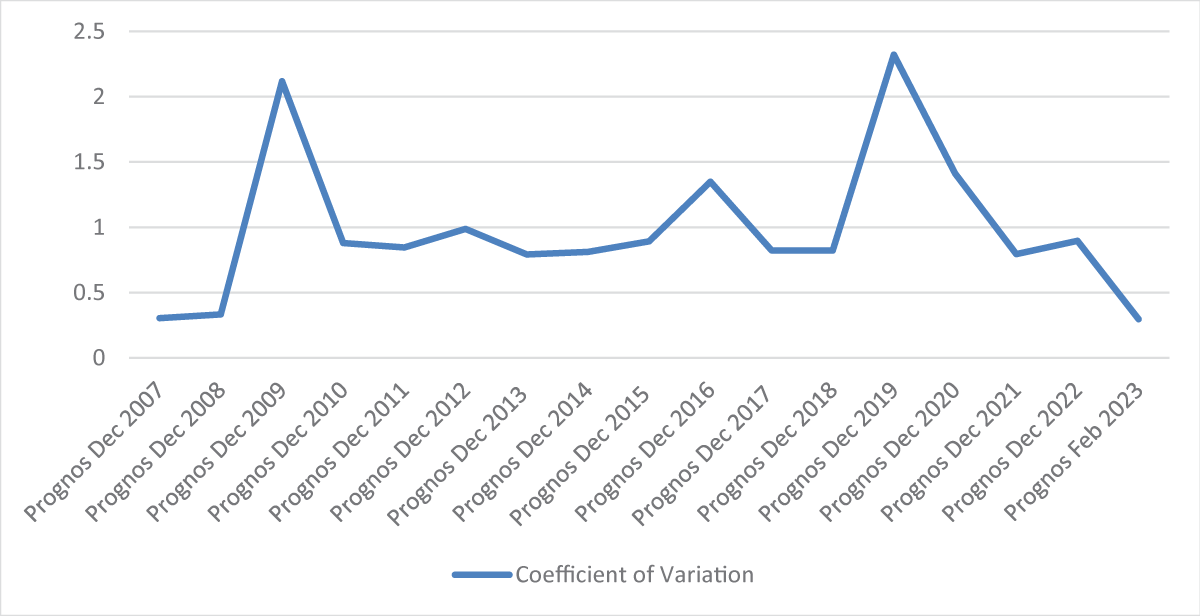
Looking at the coefficient of variation gives a slightly different picture, as shown in Figure 7. Recall that the coefficient of variation is measured as the standard deviation divided by the mean. A low mean, close to zero, will hence inflate the coefficient of variation. The coefficient of variation is remarkably high for the prognoses made in 2009 and 2019, with a coefficient of variation above two. Prognoses made in 2016 and 2020 were also above one. Overall, the coefficient of variation is above or close to one, and by standard measure, considered to be high, indicating that the prognoses are not very precise.
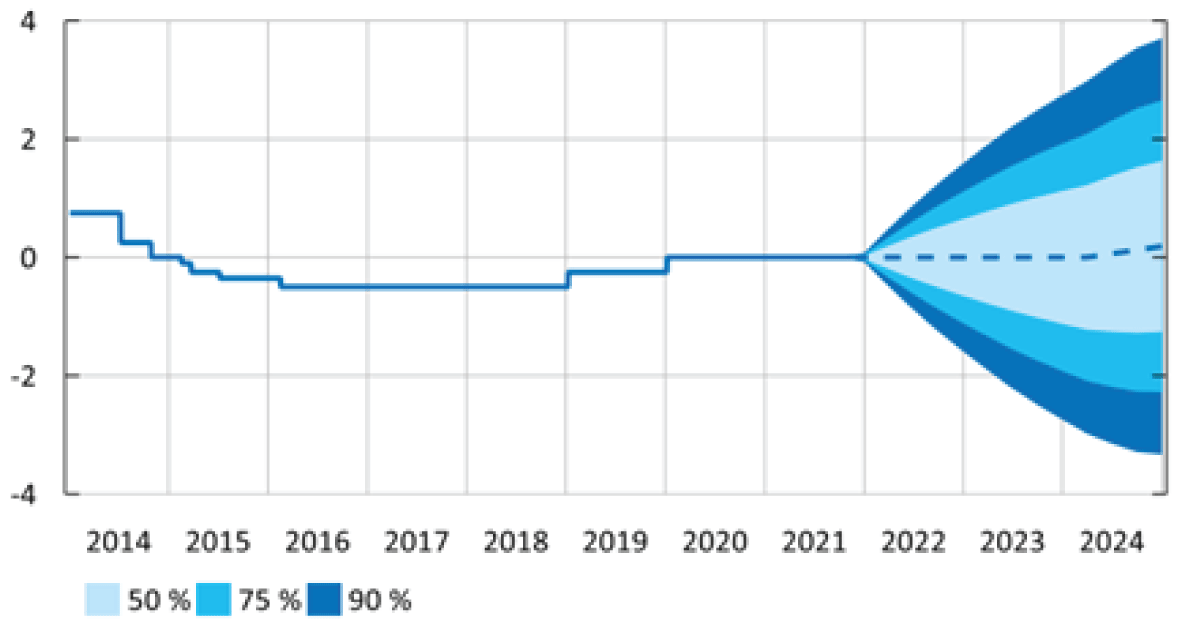
Policy rate forecasts from the Central Bank are presented within confidence intervals, with either 50%, 75%, or 90% certainty. This gives the impression that the forecasts are predicted with some level of certainty and accuracy. Figure 8 is taken from the Central Bank’s November 2021 Monetary Policy Report. The report forecasts policy rates to be zero for the next few years and then a very slight increase in April 2024. The report also presents confidence intervals for their forecasts (in different shades of blue). With 50% certainty, the Central Bank predicts that the interest rate in January 2023 will be in the range between -0.79% and 0.79%. With 75% certainty, the rate is predicted to be between -1.34% and 1.34% and with 90% confidence, the rate is predicted to be between -1.91 and 1.91%. The actual rate in January 2023 was 2.5%. Hence, the actual rate did not fall within the 90% confidence interval.
Figure 8: Policy rate forecast and confidence interval, Forecast Nov 2021 Percent. Source: Monetary Policy Report, Riksbanken [44The Riksbank (2023). Monetary policy report, various reports, https://www.riksbank.se/sv/press-och-publicerat/publikationer/penningpolitisk-rapport/].
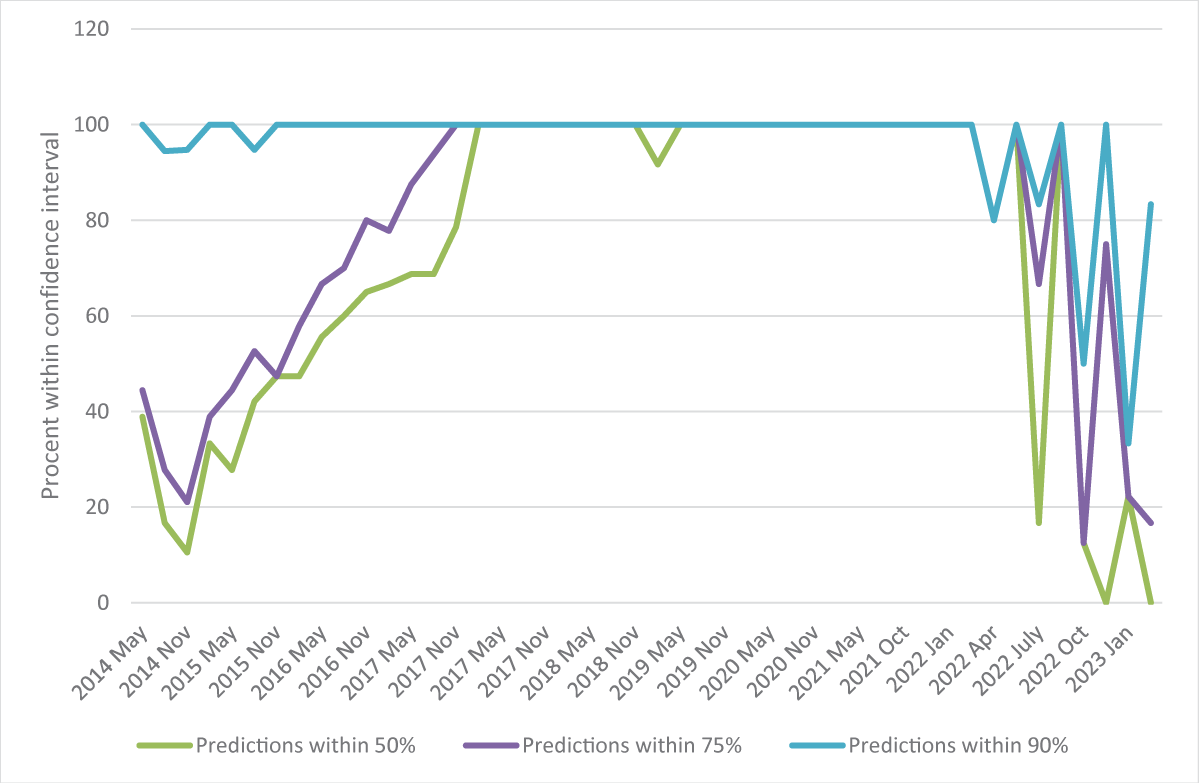
To the Central Bank’s defense, it is uncommon for forecasted rates to fall outside the 90% confidence interval. Figure 9 illustrates how often policy rate predictions are accurate depending on different confidence intervals between May 2014 and Feb 2023. To be justified, we would expect 50% of the predictions to be within the 50% confidence interval, 75% within the 75% confidence interval, and 90% within the 90% confidence interval. The blue line shows the percentage of predictions that fell within the 90% confidence interval. The blue line is above 90% up until April 2022, after that predictions are outside the 90% range. In 2023 only 35% of the predictions were within the 90% confidence interval. The yellow line shows the percentage of predictions within the 75% confidence interval. We would expect 75% of predictions to fall within this range. However, predictions underperformed in 2014 to 2016 and again in 2022 and 2023. Lastly, the grey line illustrates the percentage of predictions within the 50% confidence interval. Again, the predictions underperformed in 2014 to 2016 and in 2022 and 2023.
Figure 9: Predictions within different confidence intervals, May 2014 to Feb 2023. Source: Monetary Policy Report, Riksbanken [44The Riksbank (2023). Monetary policy report, various reports, https://www.riksbank.se/sv/press-och-publicerat/publikationer/penningpolitisk-rapport/].
During the studied period, nearly 73% of the predictions were within the 50% confidence interval, and 80 and 96% within the 75% and 90% confidence intervals, respectively. However, there is variation across the period. Predictions of rates in 2014, 2015, and 2022 were outside the confidence interval. The figure does not include the financial crisis, a period when predictions were off (as shown before). As mentioned earlier, rate predictions performed fairly well during the period 2014 to 2018.
Both over- and underestimations have consequences for investment and savings decisions. Overestimations of future rates may deter individuals and firms from borrowing and undertaking investments, while underestimating future rates may put them under financial stress. An example of the consequences of a sudden hike in interest rates is illustrative. In 2022, the average new loan was 2.82 million SEK (about €280,000) in Sweden and 3.94 million SEK (about €395,000) in Stockholm [55The Financial Supervisory Authority. (2023). The Swedish mortgage market in 2023. https://www.fi.se/sv/publicerat/rapporter/bolanerapporter/den-svenska-bolanemarknaden-2023/]. Most loans in Sweden are at variable interest rates. An increase in the interest rate of 3% points means that the monthly interest payments increase by 7,050 SEK for the average new loan and by 9,850 SEK for the average new loan in Stockholm. Given an average monthly gross labor income in Sweden of 37,100 SEK in 2021 [66(2023). https://www.scb.se/hitta-statistik/statistik-efter-amne/arbetsmarknad/loner-och-arbetskostnader/lonestrukturstatistik-hela-ekonomin/pong/tabell-och-diagram/genomsnittlig-manadslon-efter-sektor/], nearly 20% of the gross monthly income of one person (for a couple, the cost can be shared) is needed to cover the increased interest payments, or 27% for a borrower in Stockholm, all else being the same. This is a sharp increase in monthly expenses and will likely impact households’ financial position and put some in severe financial distress.
This raises the question of who should bear the risk of mispredictions. Is it reasonable for households to prepare themselves for policy rates that are outside the 90% confidence interval? Is it reasonable that the borrower carries the entire risk, or should the Central Bank be held accountable to some degree for making mispredictions? The forecasts, especially when presented with some level of certainty, give the impression that they are to be trusted.
Who should bear the risk?
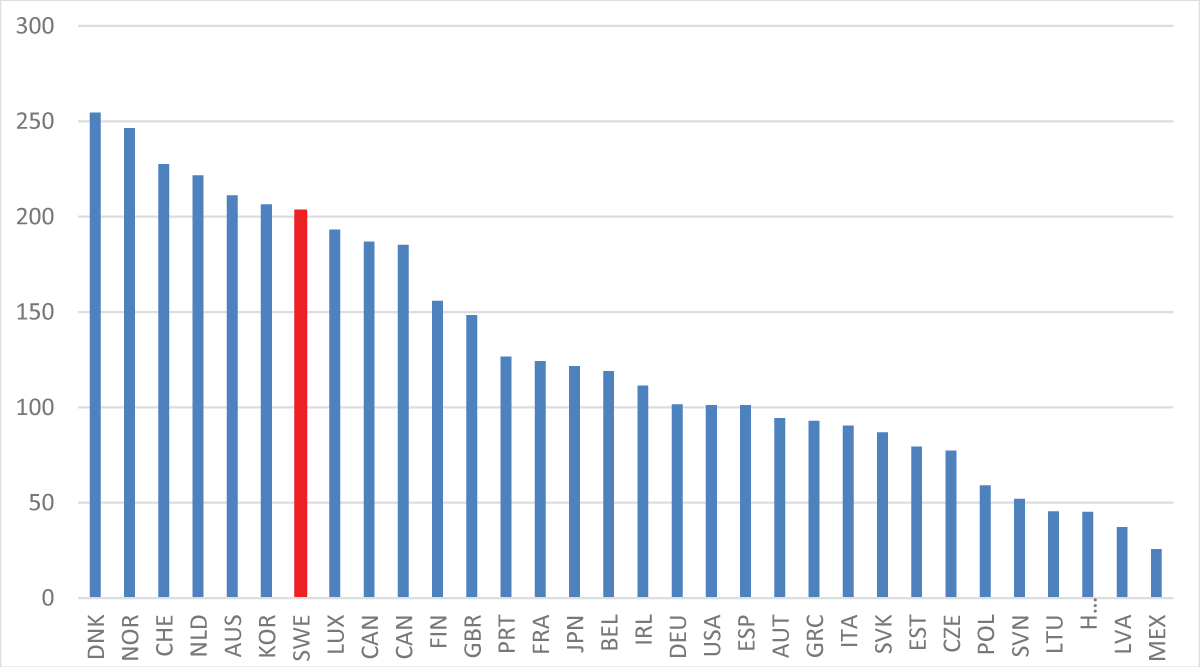
Household debt is high in Sweden, as shown in Figure 10. Alongside Denmark and Norway, Sweden ranks among the countries in Europe with the highest household debt as a share of net disposable income. High debt levels and variable interest rates make households vulnerable to increased policy/interest rates. Interestingly, the tax system encourages debt financing, as interest payments are deductible, but no deductions are granted for equity. There is a further asymmetry, as returns to housing investments are taxed at lower rates than the 30% interest deduction rate.
Figure 10: Household debt in OECD countries, percent of net disposable income in 2021. Source: OECD [77OECD (2023) Household debt (indicator). doi: 10.1787/f03b6469-en.].
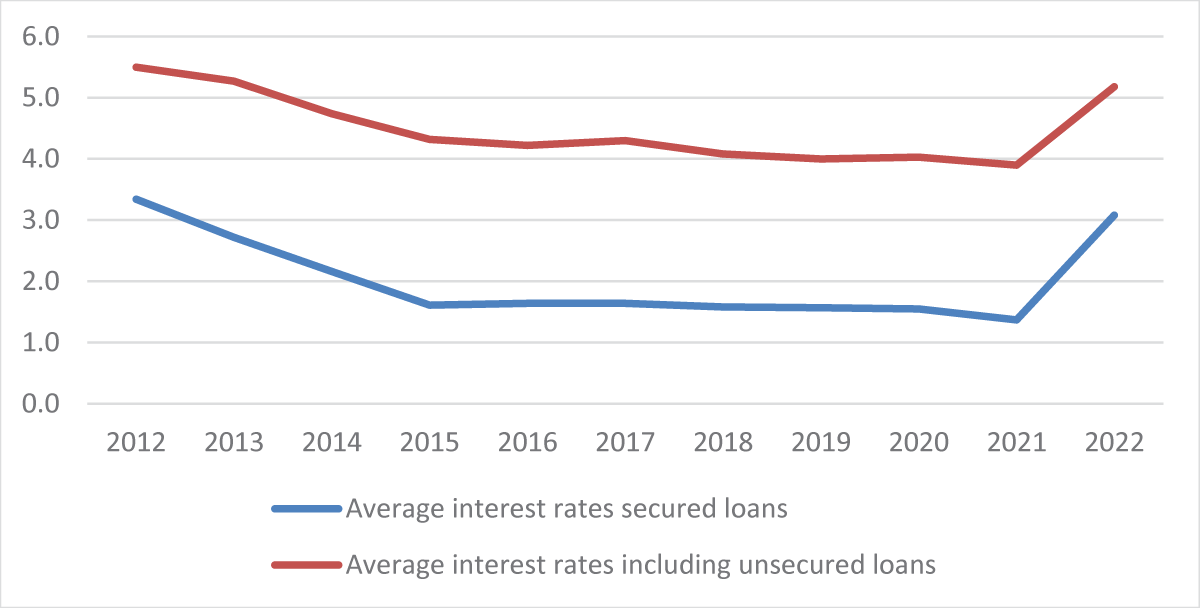
According to Finansinspektionen [55The Financial Supervisory Authority. (2023). The Swedish mortgage market in 2023. https://www.fi.se/sv/publicerat/rapporter/bolanerapporter/den-svenska-bolanemarknaden-2023/], 60% of all new loans issued in 2022 were at variable interest rates (a 3-month fixed rate). Figure 11 shows the average interest rates for new home loans over time for secured and unsecured loans. There is a sharp hike in 2022 when the average interest rate more than doubled for secured loans, from 1.4% to 3.1% (an increase of 125%). For loans, including unsecured loans, the increase was less drastic, from 3.9 to 5.2 (an increase of 33%.
Figure 11: Average interest rates for new loans, secured and unsecured, 2012-2022. Source: Finansinspektionen [55The Financial Supervisory Authority. (2023). The Swedish mortgage market in 2023. https://www.fi.se/sv/publicerat/rapporter/bolanerapporter/den-svenska-bolanemarknaden-2023/].
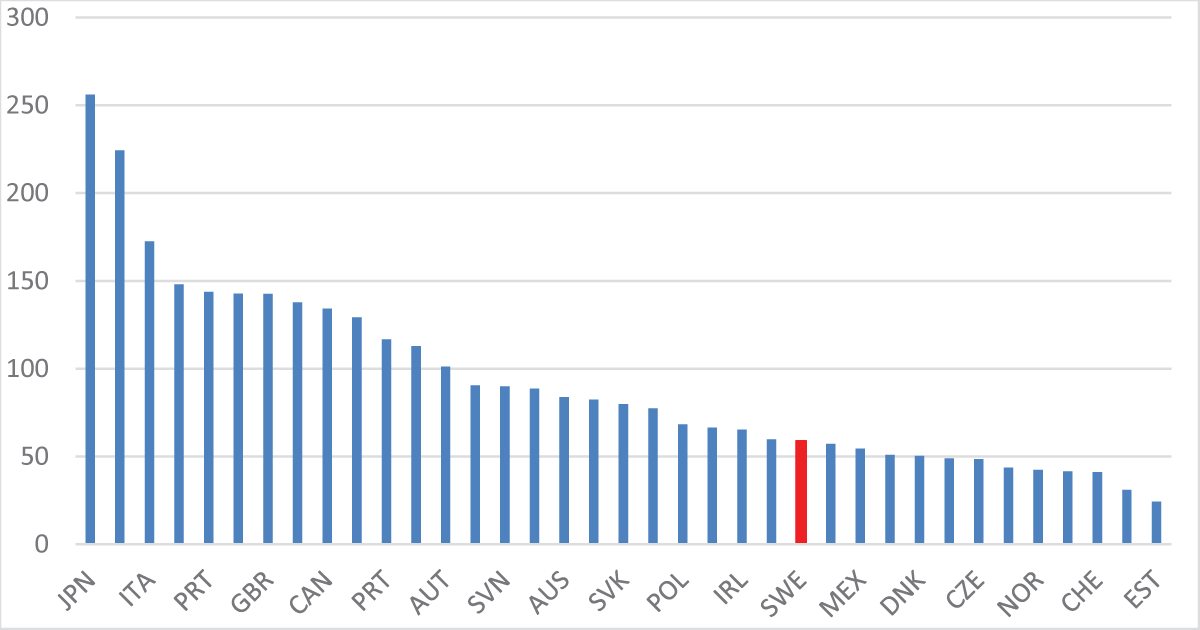
Sweden has high household debt but low public debt. Public debt ratios, i.e., public debt over GDP, in OECD countries are presented in Figure 12. Sweden, along with other Scandinavian countries, has relatively low public debt ratios, while also having large household debts. There is a negative correlation between household and public debts; the correlation coefficient between household and public debt among OECD countries was -0.15 in 2021.
Figure 12: Public debt in OECD countries, percent of GDP in 2021. Source: OECD [88OECD (2023) General government debt (indicator). doi: 10.1787/a0528cc2-en.].
Obviously, it is desirable to have low public debt ratios as it gives the government room to act and borrow at relatively low-interest rates. However, it may be less desirable if it comes at the expense of higher household debt levels. The question is whether it matters who holds the debt – households or governments. More generally, who is best equipped to carry risks: governments or households? How should the risk and consequences of sudden and unpredicted increases in interest rates be dealt with? Is it reasonable that individuals or households take full responsibility, or should the Central Bank, private banks, or any other agents be held partly responsible and accountable when predictions about future rates are way off?
To address the issue of who is best suited to carry risk, it may be useful to lean on the theory of the superior insurer [99Posner P, Rosefield AM. Impossibility and related doctrins in contract law. Journal of Legal Studies. 1977; 1: 65-82.], a concept rooted in the economic analysis of law. The central idea is based on the assumption that certain entities or institutions, due to their characteristics and capabilities, are better suited to bear and manage risks compared to others. The theory explores the implications of allocating risks to entities that are more efficient or better equipped to handle them.
In summary, the theory of the superior insurer is a conceptual framework that explores the efficient allocation of risks to entities best equipped to handle them, with implications for legal and regulatory frameworks. According to this principle, the entity that is most suitable (superior) to carry risk depends on:Risk preferences,
Cost to reduce risk and
Ability to control the risk.
The entity that is most suitable to carry risk is the one that dislikes risk the least or is risk-neutral and has the lowest cost of reducing the risk (e.g., by self-insuring or by transferring the risk to somebody else, such as an insurance company), and the entity that can impact the risk and the consequences of the risk.
Risk preferences differ between agents/individuals. Somebody who is risk-neutral is indifferent between a situation where he or she is expected to receive a certain amount and receiving that same amount with certainty. A risk-averse individual prefers a situation with certainty and is willing to pay a premium to be in a situation with certainty. Most individuals are risk-averse and prefer certainty over uncertainty but to different degrees. If risks are carried by risk-averse individuals when there are risk-neutral individuals, costs can be reduced (or welfare improved) if risks are transferred to risk-neutral individuals. Hence, it is preferable if risk-neutral or the least risk-averse individuals carry risks rather than more risk-averse individuals.
The cost to reduce risk, for example, by buying insurance or self-insuring by diversifying, matters as well. The individual or entity that can insure at the lowest cost should carry the risk. Governments can self-insure by their sheer size; that is not possible for a single individual. Regarding this aspect, governments are therefore more suitable to carry risks than individuals.
The last aspect, the ability to control risk, is important to prevent moral hazard and implies that the entity that can control and impact the risk, or the cost the risk gives rise to, should carry the risk. If the entity that can control the risk does not carry the risk, there is a lack of incentives to try to prevent the risk from occurring. This aspect argues for levying the risk on individuals if they can control the risk or the cost of the risk.
Commonly, the three aspects do not coincide with the same individual/entity. The entire risk does not need to be on the same entity but could be shared for more efficient risk-sharing. To illustrate how risks can be shared, the design of sickness benefits in Sweden can serve as an example. In Sweden, the risk or cost of being sick is shared between the government, employers, and individuals. Individuals pay by losing 20% of their income while sick; employers pay the remaining 80% for the first two weeks of sickness, after which the government steps in and takes over. The government is likely to have the lowest risk aversion. The government, by its sheer size, is also likely to be the entity that can insure at the lowest cost. However, the government has little power to control whether a person gets sick and the cost of being sick. The individual, on the other hand, probably has the highest risk aversion, and the highest cost to reduce the risk by insuring, but has more power to control the probability of becoming sick. To avoid moral hazard, the individual should carry some risk, but the other two aspects favor the government as a risk carrier. The employer may be somewhere in between the government and the individual. The employer has lower risk aversion than the individual but higher than the government, and lower cost to insure than the individual but higher than the government. When it comes to being able to influence the risk, the employer may have more to say in that matter than the government, as the work environment affects employees’ health, but most likely less than the individual. Hence, the risk may be shared among the different entities to spread the risk more efficiently than if only one of the entities carried the entire risk.
The same logic can be used when dealing with risks associated with sudden and unexpected interest rate increases. How should that risk be distributed among different stakeholders? The two first aspects, dealing with risk preferences and the cost to reduce risks, favor governments as superior risk carriers. The last aspect, the moral hazard consideration, is important to investigate as it impacts whether the risk materializes and the cost of the risk. Obviously, individuals or households can neither impact interest rate predictions nor actual interest rates, but they can impact the cost of the risk. If individuals held zero risk for the cost of interest rate hikes, they would act more irresponsibly and likely borrow more. Therefore, it is unreasonable for borrowers to not carry any risk. On the other hand, for them to carry the entire risk, as the risk is out of their control, maybe just as unreasonable, especially as it is not entirely up to them to decide whether they receive a loan and how much they can borrow.
Bank lending is rather regulated, and individuals are far from free to borrow as much as they may want. The banking sector regulates who and how much an individual can borrow. In general, individuals need to be employed to be able to borrow. How much an individual can borrow depends on the value of the property and the perceived ability of the borrower to pay for the loan. The regulations stipulate that the maximum loan that can be granted, using the house as security, is 85% of the value of the house. Above that, loans can be granted without security at higher interest rates. There are also rules about amortizations. If loans are above 70% of the value, the borrower must pay off 2% of the principal each year. If loans are between 50 and 70% of the value, 1% of the principal needs to be paid off yearly. In addition, households with loans exceeding 450% of gross income need to pay off an additional 1% of the principal yearly. A borrower with a loan above 70% of the value and where the loan exceeds 450% of the gross income is, hence, required to pay off 3% of the principal each year.
Before granting loans, banks conduct a KALP analysis (money left to live on) with a more conservative interest rate to ensure that individuals have the means to pay for the loan and other housing expenses if interest rates go up and still have enough to live on. In March 2023, the average rate the banks used was 6.4% [55The Financial Supervisory Authority. (2023). The Swedish mortgage market in 2023. https://www.fi.se/sv/publicerat/rapporter/bolanerapporter/den-svenska-bolanemarknaden-2023/], which is above the policy rate but lower than the 7% rate banks used in their KALP analysis between 2015 and 2020.
For individuals, the loan is personal and stays with the borrower regardless of what happens to the value of the house or the ability of the individual to pay. Individuals can apply for debt relief if they cannot pay back their debt in the foreseeable future. If granted debt relief, the individual is still required to make serious attempts to pay back part of the loan and take other drastic measures to cut costs. After five years, debt relief is offered, but fewer people are granted debt relief. Five years ago, 60% of those who applied were granted debt relief; last year, that number was 35% [1010(2023). Continued great interest in debt restructuring. Press release Feb 2013, https://kronofogden.se/om-kronofogden/nyheter-och-press/pressmeddelanden/2023-02-15-fortsatt-stort-intresse-for-skuldsanering].
Individuals can reduce interest rate risks by borrowing at fixed interest rates. In Sweden, fixed interest rates are commonly between one to five years, but fixed rates for ten years also exist. It is not uncommon to divide up the loan between variable and fixed rates to reduce exposure to interest rate fluctuations. As mentioned before, the majority of new loans are taken at variable rates (60%). The borrower can also protect themselves against events that make it hard to pay the loan by buying insurance that covers risks for the death of a spouse, unemployment, sickness, or other inabilities to work. The premium for these insurances varies but is commonly in the range of five to 10% of the monthly cost of the loan.
If the borrower meets all the regulations and takes height for the predictions made by the Central Bank about future policy rates within a 90% confidence interval, is it still reasonable for the borrower to carry the entire interest rate risk? Currently, the Central Bank carries no cost for their mispredictions. It may be reasonable if the Central Bank steps in and carries some of the risks associated with their mispredictions or at least strongly signals to the public that their predictions should not be taken at face value. Hassler, et al. [1111Hassler J, Krusell P, Seim A. Evaluation of monetary policy 2022, Riksdagtryckeriet, Stockholm. 2023.] suggest that the Central Bank conditions their predictions on certain future scenarios. This would increase individuals’ awareness of the possibility of different possible scenarios. If the Central Bank were responsible for some of the risks and costs of mispredictions, they would most likely be more careful in their statements. Private banks granting the loans take small risks when it comes to private loans, as the loans are personal and it is hard for individuals to “go bankrupt.” If banks don’t carry any risk, they have strong incentives to lend out money in excess as that increases their profit. That is one strong argument for the banks being regulated. Banks could alternatively carry more of the risk, making them more careful when lending.
In conclusion, risk sharing could likely become more efficient if some of the individual risks, risks that are outside their control, were transferred to the banking sector (both the Central Bank and private banks) or the government.
The Swedish Central Bank has not been particularly successful in predicting future policy rates. Mispredictions, both under- and overpredictions, can have significant impacts on households and individuals. Underpredictions may lead to lower levels of investment, while overpredictions put households and individuals under severe financial stress. Mispredictions are particularly pronounced when sudden or unexpected events occur, such as the financial crisis, supply chain problems during the COVID-19 pandemic, and the invasion of Ukraine. Currently, households and private individuals bear almost the entire risk and cost of sudden interest rate hikes. Given that the Central Bank presents its predictions within certain confidence intervals and that borrowing is restricted by regulations, it can be questioned whether it is reasonable to place the entire burden on individuals.
Is it reasonable for individuals/households to bear the entire risk when they consider the margins provided by the Central Bank, in the form of confidence intervals, and comply with the regulations that banks require regarding who and how much individuals can borrow and how loans need to be amortized? Additionally, and strangely, the tax system encourages individuals/households to borrow rather than use equity by allowing interest deductions.
According to the principles of the superior risk carrier or insurer, it is challenging to justify that individuals/households bear the entire risk. Individuals are neither the least risk-averse nor have the lowest cost to reduce risks. They cannot influence future inflation or predictions, that lie in the hands of the Central Bank. While individuals need to bear some risk to prevent excessive borrowing, it may be justified for the Central Bank to be held accountable to some degree, possibly transferring some of the risk to private banks. If private banks carried more of the risks, they would have greater incentives for self-regulation in lending.
Sewell M. The Efficient Market Hypothesis: Empirical Evidence, International Journal of Statistics and Probability. 2012; 2.
Fama E. Efficient Capital Markets: A Review of Theory and Empirical Work. Journal of Finance. 1970; 25(2): 383-417.
Byström H. Finance: Markets, instruments and investments, Student Literature. 2020.
The Riksbank (2023). Monetary policy report, various reports, https://www.riksbank.se/sv/press-och-publicerat/publikationer/penningpolitisk-rapport/
The Financial Supervisory Authority. (2023). The Swedish mortgage market in 2023. https://www.fi.se/sv/publicerat/rapporter/bolanerapporter/den-svenska-bolanemarknaden-2023/
OECD (2023) General government debt (indicator). doi: 10.1787/a0528cc2-en.
Posner P, Rosefield AM. Impossibility and related doctrins in contract law. Journal of Legal Studies. 1977; 1: 65-82.
(2023). Continued great interest in debt restructuring. Press release Feb 2013, https://kronofogden.se/om-kronofogden/nyheter-och-press/pressmeddelanden/2023-02-15-fortsatt-stort-intresse-for-skuldsanering
Hassler J, Krusell P, Seim A. Evaluation of monetary policy 2022, Riksdagtryckeriet, Stockholm. 2023.
Hansson A. Wishful Thinking or Valuable Forecasts? The Value of Policy Rate Predictions in Sweden. IgMin Res. Nov 16, 2023; 1(1): 047-059. IgMin ID: igmin116; DOI: 10.61927/igmin116; Available at: www.igminresearch.com/articles/pdf/igmin116.pdf
Address Correspondence: Åsa Hansson, Department of Economics, Technology and Society and SoeTech, Lund University, Sweden, Email: [email protected]
How to cite this article: Hansson A. Wishful Thinking or Valuable Forecasts? The Value of Policy Rate Predictions in Sweden. IgMin Res. Nov 16, 2023; 1(1): 047-059. IgMin ID: igmin116; DOI: 10.61927/igmin116; Available at: www.igminresearch.com/articles/pdf/igmin116.pdf
Figure 1: Mean monthly Central Bank policy rates in Sweden, ...
Figure 2: Actual policy rates and rates forecasted at variou...
Figure 3: Actual policy rate at different times and the size...
Figure 4: Coefficient of variation of predicting policy rate...
Figure 5: Forecast deviations from actual rates, forecasts b...
Figure 6: Accuracy, measured as standard deviation, for diff...
Figure 7: Coefficient of variation for various predictions, ...
Figure 8: Policy rate forecast and confidence interval, Fore...
Figure 9: Predictions within different confidence intervals,...
Figure 10: Household debt in OECD countries, percent of net d...
Figure 11: Average interest rates for new loans, secured and ...
Figure 12: Public debt in OECD countries, percent of GDP in 2...
Sewell M. The Efficient Market Hypothesis: Empirical Evidence, International Journal of Statistics and Probability. 2012; 2.
Fama E. Efficient Capital Markets: A Review of Theory and Empirical Work. Journal of Finance. 1970; 25(2): 383-417.
Byström H. Finance: Markets, instruments and investments, Student Literature. 2020.
The Riksbank (2023). Monetary policy report, various reports, https://www.riksbank.se/sv/press-och-publicerat/publikationer/penningpolitisk-rapport/
The Financial Supervisory Authority. (2023). The Swedish mortgage market in 2023. https://www.fi.se/sv/publicerat/rapporter/bolanerapporter/den-svenska-bolanemarknaden-2023/
OECD (2023) General government debt (indicator). doi: 10.1787/a0528cc2-en.
Posner P, Rosefield AM. Impossibility and related doctrins in contract law. Journal of Legal Studies. 1977; 1: 65-82.
(2023). Continued great interest in debt restructuring. Press release Feb 2013, https://kronofogden.se/om-kronofogden/nyheter-och-press/pressmeddelanden/2023-02-15-fortsatt-stort-intresse-for-skuldsanering
Hassler J, Krusell P, Seim A. Evaluation of monetary policy 2022, Riksdagtryckeriet, Stockholm. 2023.


 Scan and get link

![Mean monthly Central Bank policy rates in Sweden, 1998-2022. Source: Monetary Policy Report, Riksbanken [4].](https://www.igminresearch.com/articles/figures/igmin116/igmin116.g001.webp)
![Actual policy rates and rates forecasted at various times, 2008 to 2025. Source: Monetary Policy Report, Riksbanken [4].](https://www.igminresearch.com/articles/figures/igmin116/igmin116.g002.webp)
![Actual policy rate at different times and the size of mispredictions at that time Source: Monetary Policy Report, Riksbanken [4].](https://www.igminresearch.com/articles/figures/igmin116/igmin116.g003.webp)
![Coefficient of variation of predicting policy rates, 2008-2023. Source: Monetary Policy Report, Riksbanken [4].](https://www.igminresearch.com/articles/figures/igmin116/igmin116.g004.webp)
![Forecast deviations from actual rates, forecasts between 2007 to 2023, percentage points. Source: Monetary Policy Report, Riksbanken [4].](https://www.igminresearch.com/articles/figures/igmin116/igmin116.g005.webp)
![Accuracy, measured as standard deviation, for different forecasts, 2007 to 2023. Source: Monetary Policy Report, Riksbanken [4].](https://www.igminresearch.com/articles/figures/igmin116/igmin116.g006.webp)
![Coefficient of variation for various predictions, 2007 to 2023. Source: Monetary Policy Report, Riksbanken [4].](https://www.igminresearch.com/articles/figures/igmin116/igmin116.g007.webp)
![Policy rate forecast and confidence interval, Forecast Nov 2021 Percent. Source: Monetary Policy Report, Riksbanken [4].](https://www.igminresearch.com/articles/figures/igmin116/igmin116.g008.webp)
![Predictions within different confidence intervals, May 2014 to Feb 2023. Source: Monetary Policy Report, Riksbanken [4].](https://www.igminresearch.com/articles/figures/igmin116/igmin116.g009.webp)
![Household debt in OECD countries, percent of net disposable income in 2021. Source: OECD [7].](https://www.igminresearch.com/articles/figures/igmin116/igmin116.g010.webp)
![Average interest rates for new loans, secured and unsecured, 2012-2022. Source: Finansinspektionen [5].](https://www.igminresearch.com/articles/figures/igmin116/igmin116.g011.webp)
![Public debt in OECD countries, percent of GDP in 2021. Source: OECD [8].](https://www.igminresearch.com/articles/figures/igmin116/igmin116.g012.webp)